![[ICO]](/icons/blank.gif) | Name | Last modified | Size | Description |
|---|
|
|---|
![[PARENTDIR]](/icons/back.gif) | Parent Directory | | - | |
![[TXT]](/icons/text.gif) | reactome.csv | 2025-05-14 16:58 | 526K | |
| dir.txt | 2025-05-14 16:59 | 33K | |
![[IMG]](/icons/image2.gif) | Diagram of with peripher.png | 2025-05-14 16:57 | 587K | |
| Diagram of with iron overload 1 (AHMIO1).png | 2025-05-14 16:57 | 427K | |
| Diagram of with 46,XY sex reversal (AICSR).png | 2025-05-14 16:56 | 1.2M | |
| Diagram of tyrosine.png | 2025-05-14 16:55 | 323K | |
| Diagram of truncated APC mutants destabilize the destruction complex.png | 2025-05-14 16:59 | 3.3K | |
| Diagram of triacylglycerol.png | 2025-05-14 16:59 | 731K | |
| Diagram of transport Defective ABCA1 causes Tangier disease.png | 2025-05-14 16:59 | 493K | |
| Diagram of trans-Golgi Network Vesicle Budding.png | 2025-05-14 16:59 | 229K | |
| Diagram of tRNA processing in the nucleus.png | 2025-05-14 16:59 | 52K | |
| Diagram of tRNA processing in the mitochondrion.png | 2025-05-14 16:59 | 145K | |
| Diagram of tRNA processing.png | 2025-05-14 16:59 | 12K | |
| Diagram of tRNA modification in the nucleus and cytosol.png | 2025-05-14 16:57 | 200K | |
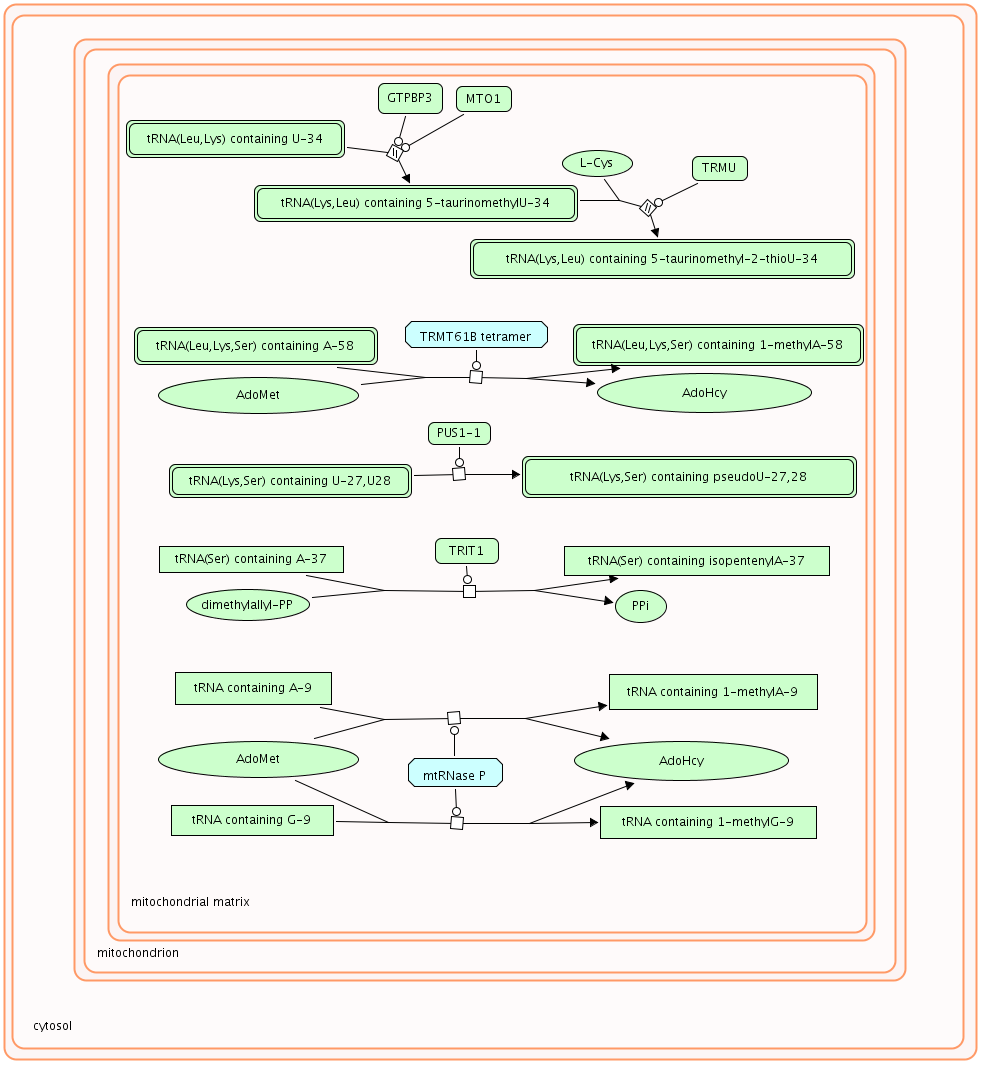
| Diagram of tRNA modification in the mitochondrion.png | 2025-05-14 16:58 | 65K | |
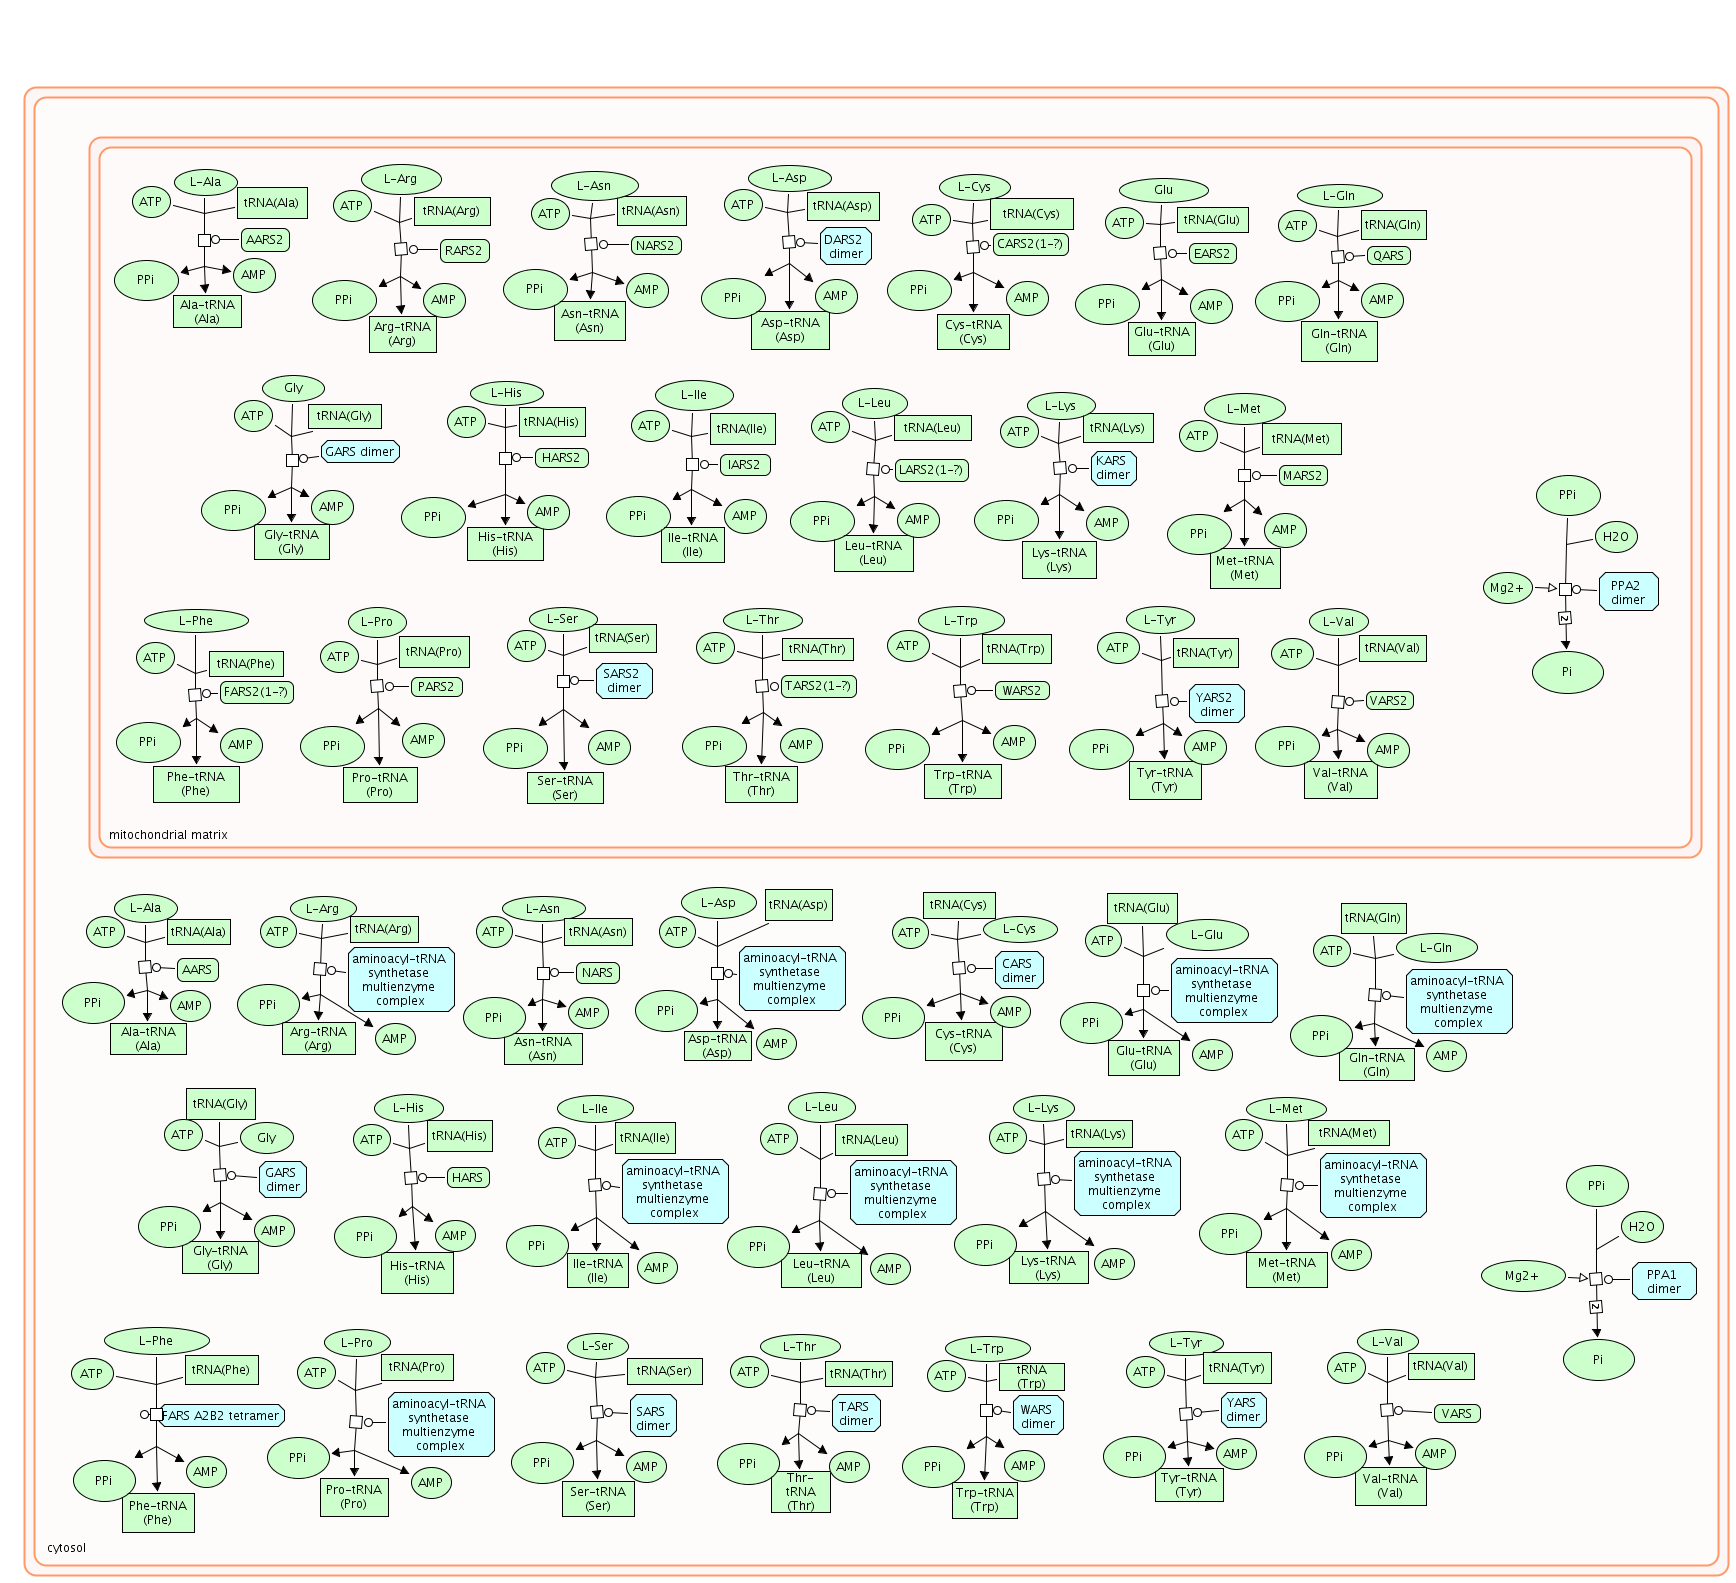
| Diagram of tRNA Aminoacylation.png | 2025-05-14 16:58 | 262K | |
| Diagram of stabilizing AXIN.png | 2025-05-14 16:55 | 492K | |
| Diagram of signaling aggregation.png | 2025-05-14 16:58 | 7.7K | |
| Diagram of secretion.png | 2025-05-14 17:01 | 74K | |
| Diagram of reuptake degradation.png | 2025-05-14 16:57 | 106K | |
| Diagram of release.png | 2025-05-14 16:56 | 106K | |
| Diagram of related molecules.png | 2025-05-14 16:57 | 181K | |
| Diagram of rRNA processing.png | 2025-05-14 16:58 | 114K | |
| Diagram of rRNA modification in the nucleus.png | 2025-05-14 16:58 | 75K | |
| Diagram of proline tryptophan catabolism Phenylketonuria.png | 2025-05-14 16:57 | 323K | |
| Diagram of phosphorylation site mutants of CTNNB1 are not targeted to the proteasome by the destruction complex.png | 2025-05-14 17:00 | 3.6K | |
| Diagram of phenylalanine.png | 2025-05-14 16:59 | 323K | |
| Diagram of nucleosides.png | 2025-05-14 16:55 | 181K | |
| Diagram of mobilization.png | 2025-05-14 16:58 | 493K | |
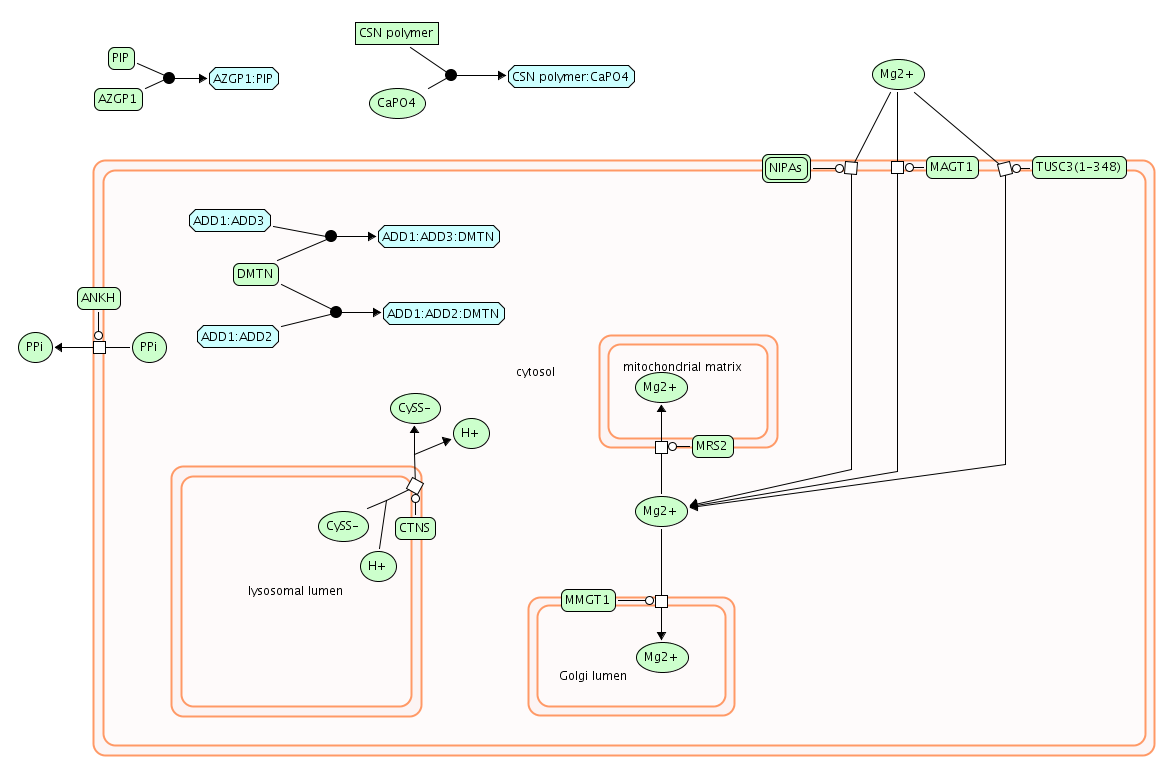
| Diagram of metal ions amine compounds.png | 2025-05-14 16:58 | 456K | |
| Diagram of mTOR signalling.png | 2025-05-14 17:00 | 133K | |
| Diagram of mRNA Editing.png | 2025-05-14 16:55 | 66K | |
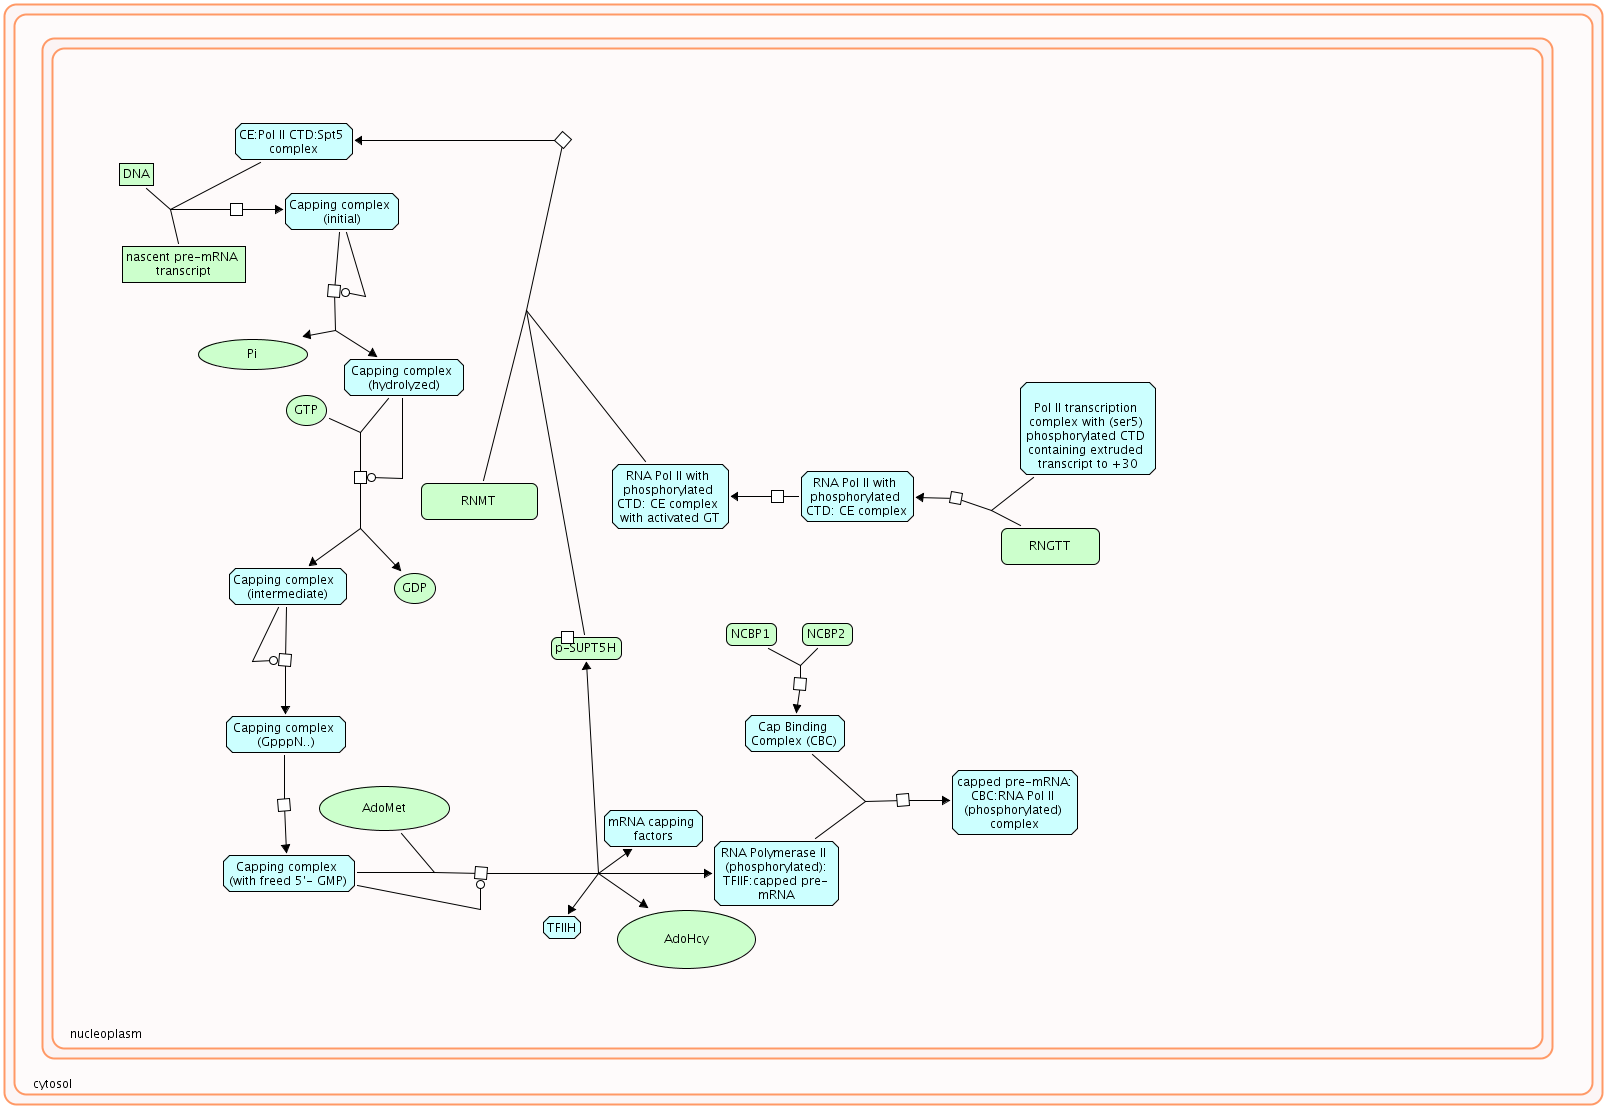
| Diagram of mRNA Capping.png | 2025-05-14 16:58 | 84K | |
| Diagram of lysine.png | 2025-05-14 17:00 | 323K | |
| Diagram of leucine rich repeat containing receptor (NLR) signaling pathways.png | 2025-05-14 16:57 | 189K | |
| Diagram of ketone body metabolism.png | 2025-05-14 16:55 | 731K | |
| Diagram of intrahepatic cholestasis of pregnancy 3 gallbladder disease 1.png | 2025-05-14 16:59 | 236K | |
| Diagram of inactivation.png | 2025-05-14 17:00 | 74K | |
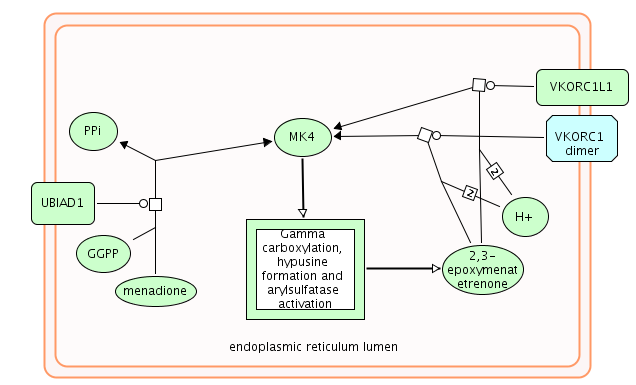
| Diagram of hypusine formation arylsulfatase activation.png | 2025-05-14 16:58 | 366K | |
| Diagram of heat production by uncoupling proteins..png | 2025-05-14 16:58 | 305K | |
| Diagram of distal renal tubular acidosis (dRTA) dRTA with hemolytic anemia (dRTA-HA).png | 2025-05-14 16:59 | 60K | |
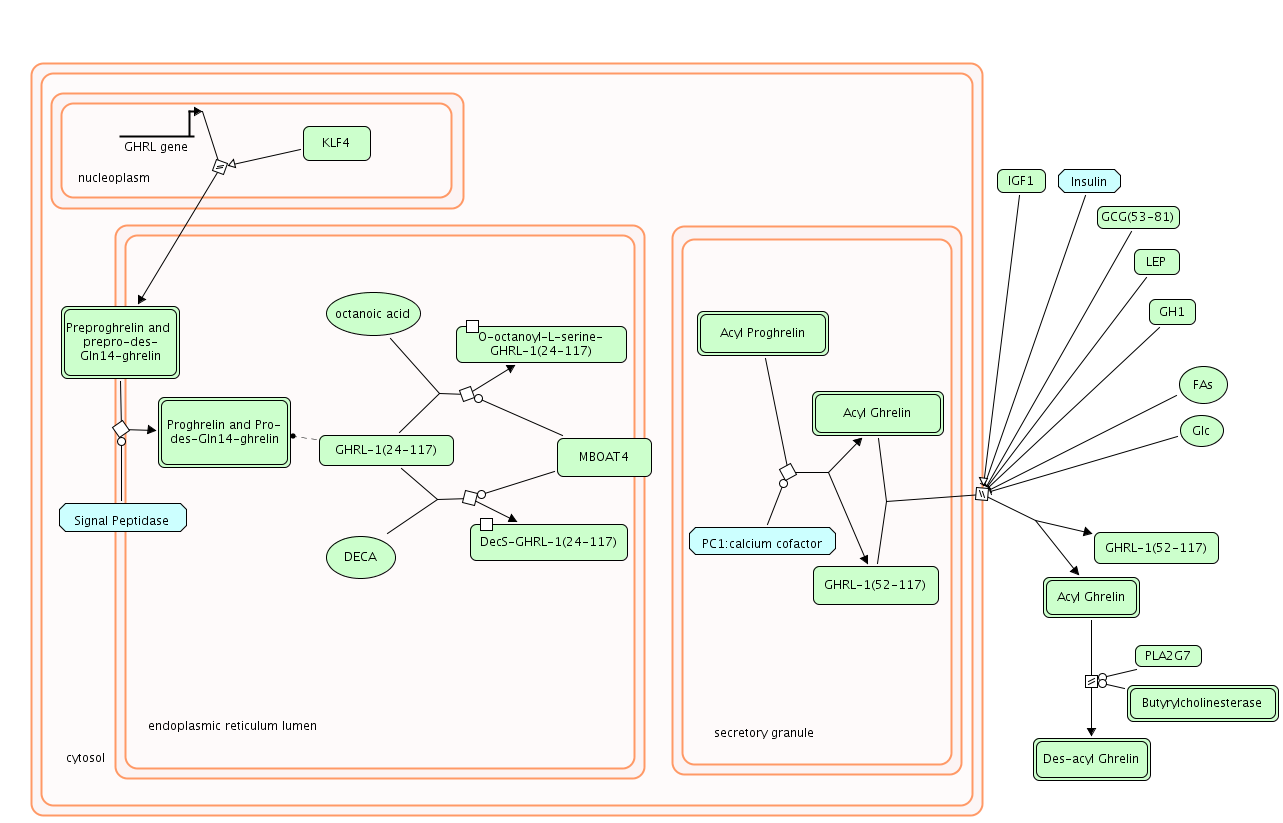
| Diagram of deacylation of Ghrelin.png | 2025-05-14 16:56 | 74K | |
| Diagram of congenital.png | 2025-05-14 17:00 | 1.2M | |
| Diagram of bile salts organic acids.png | 2025-05-14 17:00 | 456K | |
| Diagram of alpha-linolenic (omega3) and linoleic (omega6) acid metabolism.png | 2025-05-14 16:56 | 244K | |
| Diagram of activating WNT signaling.png | 2025-05-14 17:00 | 4.3K | |
| Diagram of YAP1- and WWTR1 (TAZ)-stimulated gene expression.png | 2025-05-14 16:57 | 33K | |
| Diagram of XBP1(S) activates chaperone genes.png | 2025-05-14 16:58 | 429K | |
| Diagram of XAV939 inhibits tankyrase.png | 2025-05-14 16:55 | 492K | |
| Diagram of Wax biosynthesis.png | 2025-05-14 16:55 | 38K | |
| Diagram of WNT ligand biogenesis and trafficking and WNT ligand secretion is abrogated by the PORCN inhibitor LGK974.png | 2025-05-14 16:56 | 70K | |
| Diagram of Vitamin D (calciferol) metabolism.png | 2025-05-14 16:58 | 71K | |
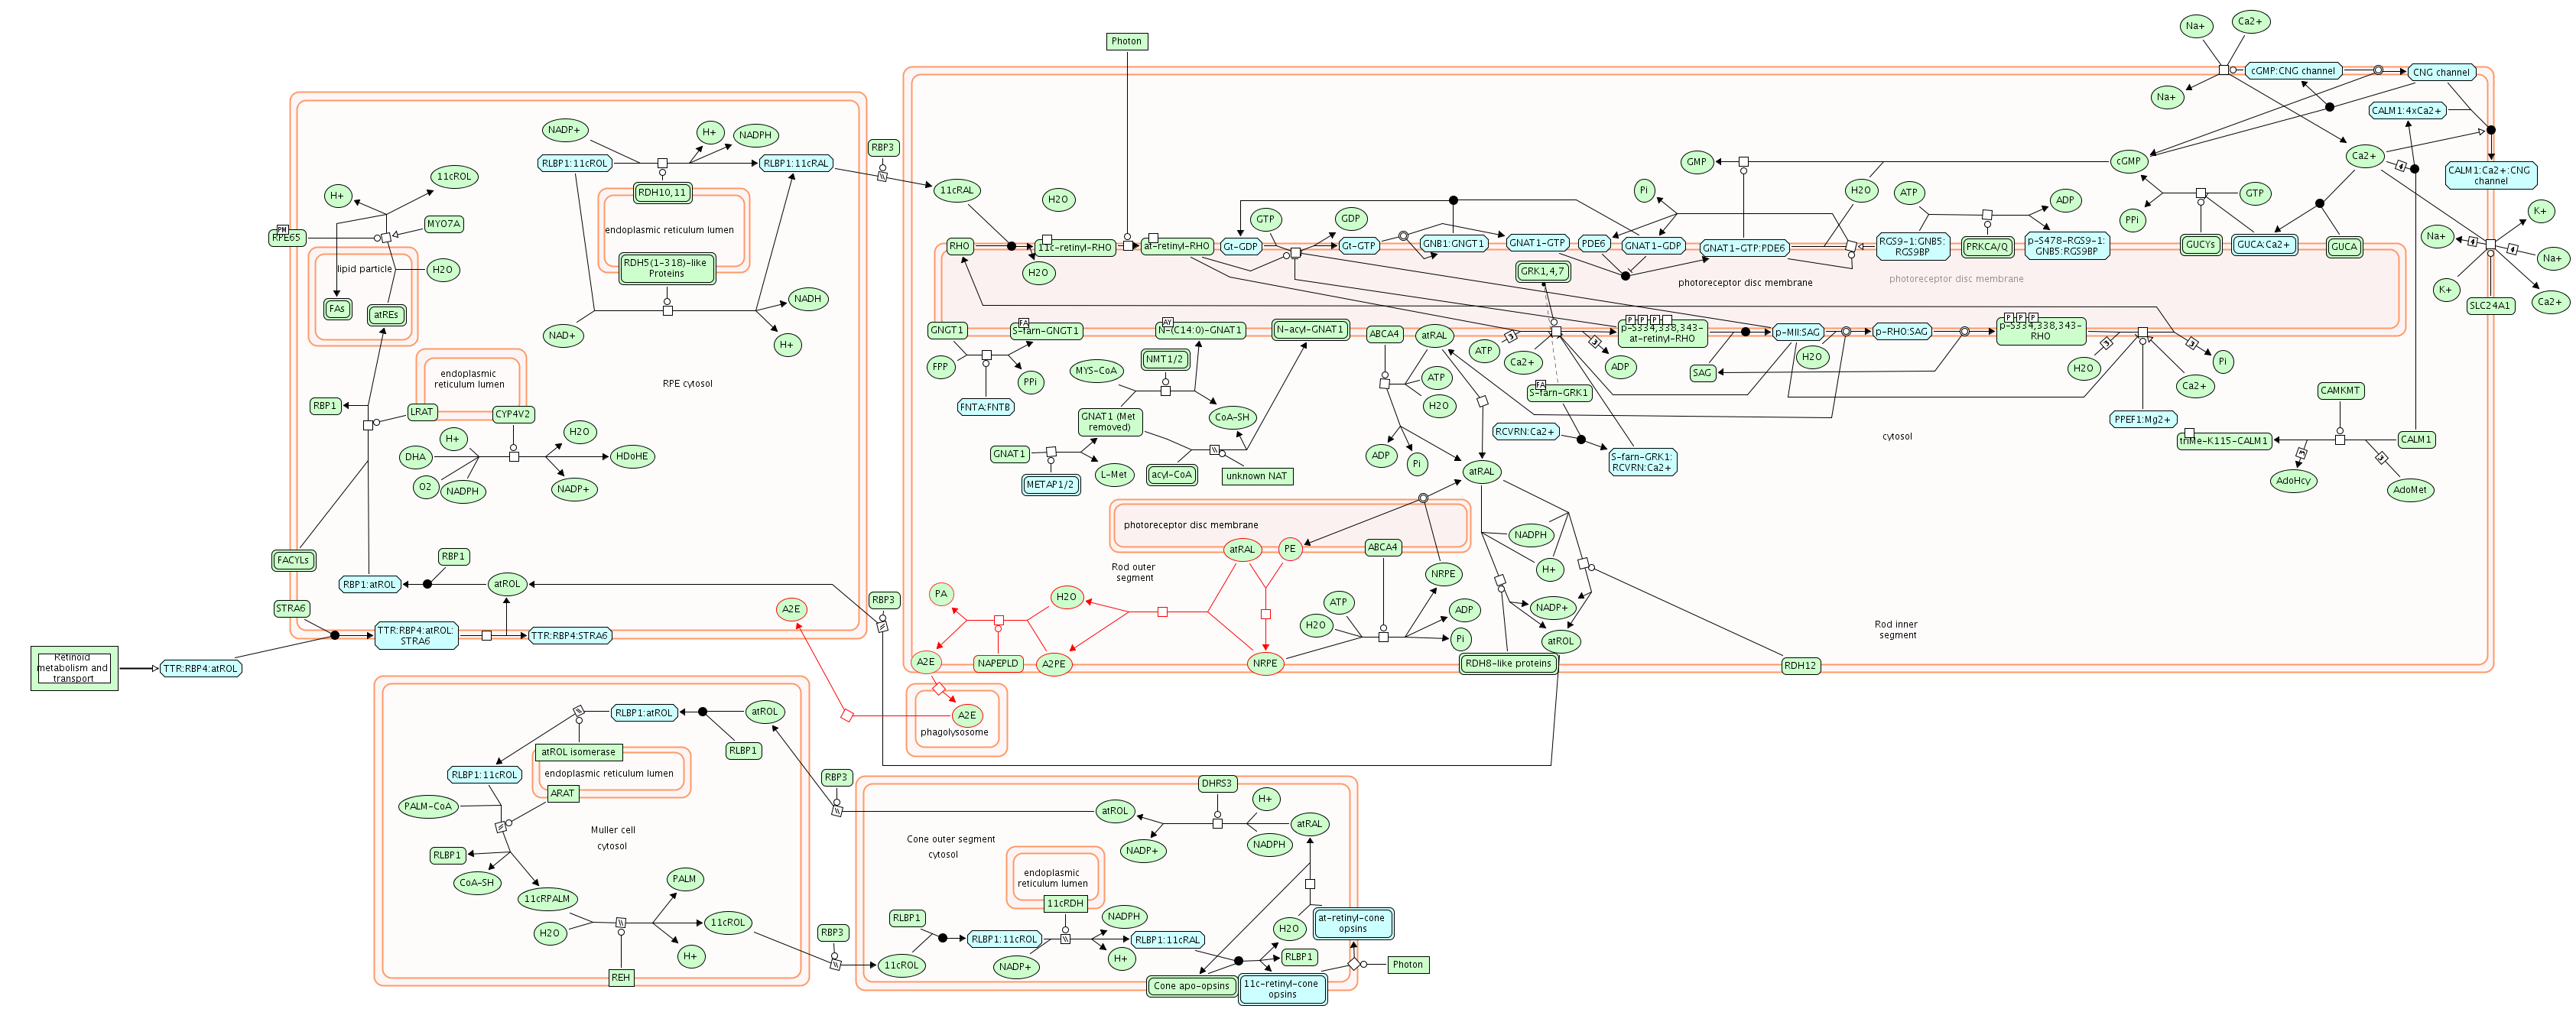
| Diagram of Visual phototransduction.png | 2025-05-14 16:56 | 375K | |
| Diagram of Visual phototransduction, Retinoid cycle disease events, and Defective SLC24A1 causes congenital stationary night blindness 1D (CSNB1D).png | 2025-05-14 17:00 | 375K | |
| Diagram of Vesicle-mediated transport.png | 2025-05-14 16:56 | 6.3K | |
| Diagram of Vasopressin regulates renal water homeostasis via Aquaporins.png | 2025-05-14 16:57 | 104K | |
| Diagram of Uptake and function of diphtheria toxin.png | 2025-05-14 16:56 | 32K | |
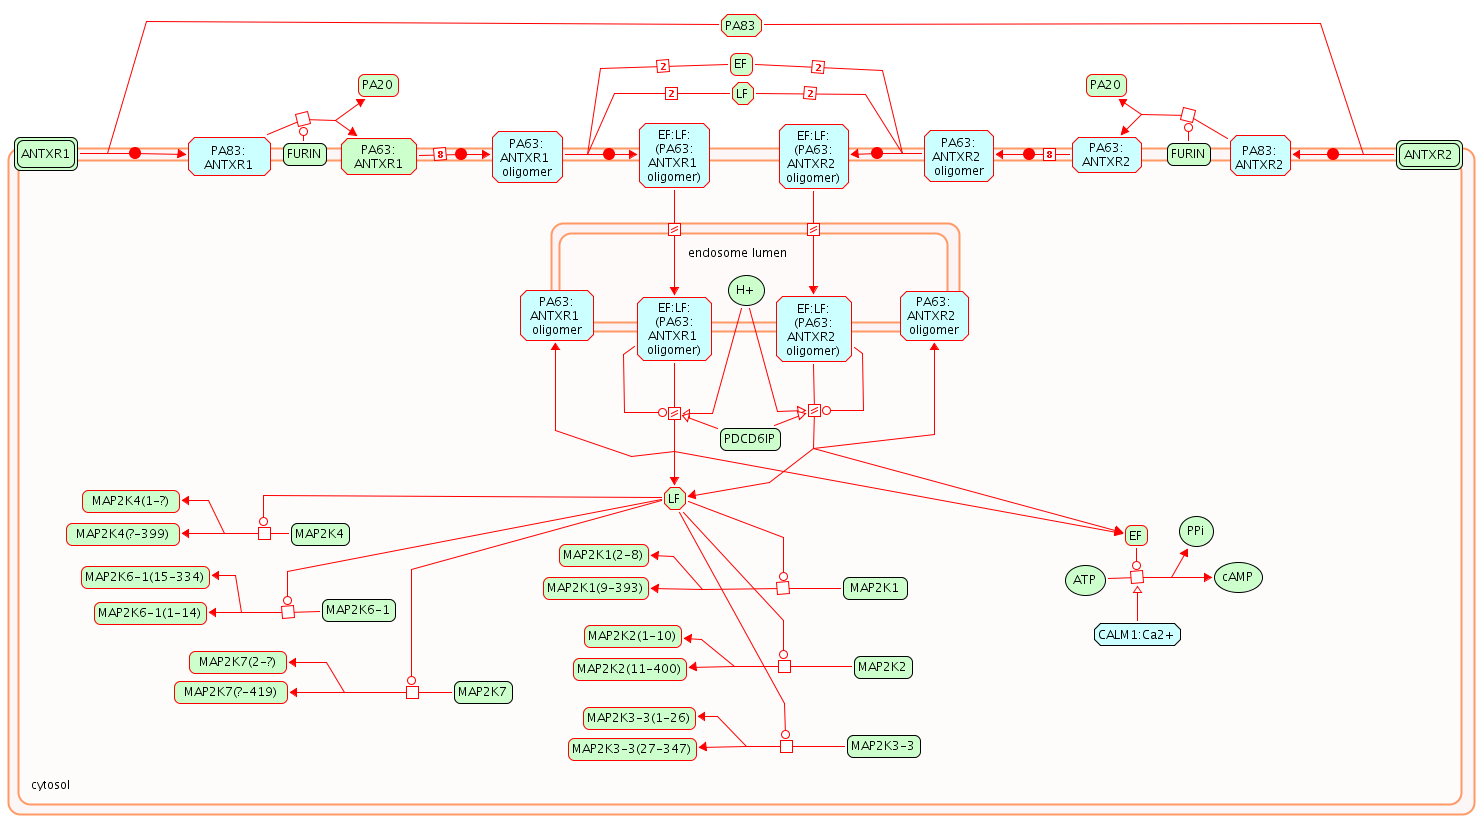
| Diagram of Uptake and function of anthrax toxins.png | 2025-05-14 16:57 | 84K | |
| Diagram of Uptake and actions of bacterial toxins.png | 2025-05-14 16:58 | 3.9K | |
| Diagram of Unfolded Protein Response (UPR).png | 2025-05-14 17:00 | 77K | |
| Diagram of Ubiquinol biosynthesis.png | 2025-05-14 16:59 | 66K | |
| Diagram of Transport of vitamins.png | 2025-05-14 16:56 | 181K | |
| Diagram of Transport of vitamins, nucleosides, and related molecules, Defective SLC27A4 causes ichthyosis prematurity syndrome (IPS), Defective SLC29A3 causes histiocytosis-lymphadenopathy plus syndrome (HLAS), Defective SLC33A1 causes spastic paraple.png | 2025-05-14 16:58 | 181K | |
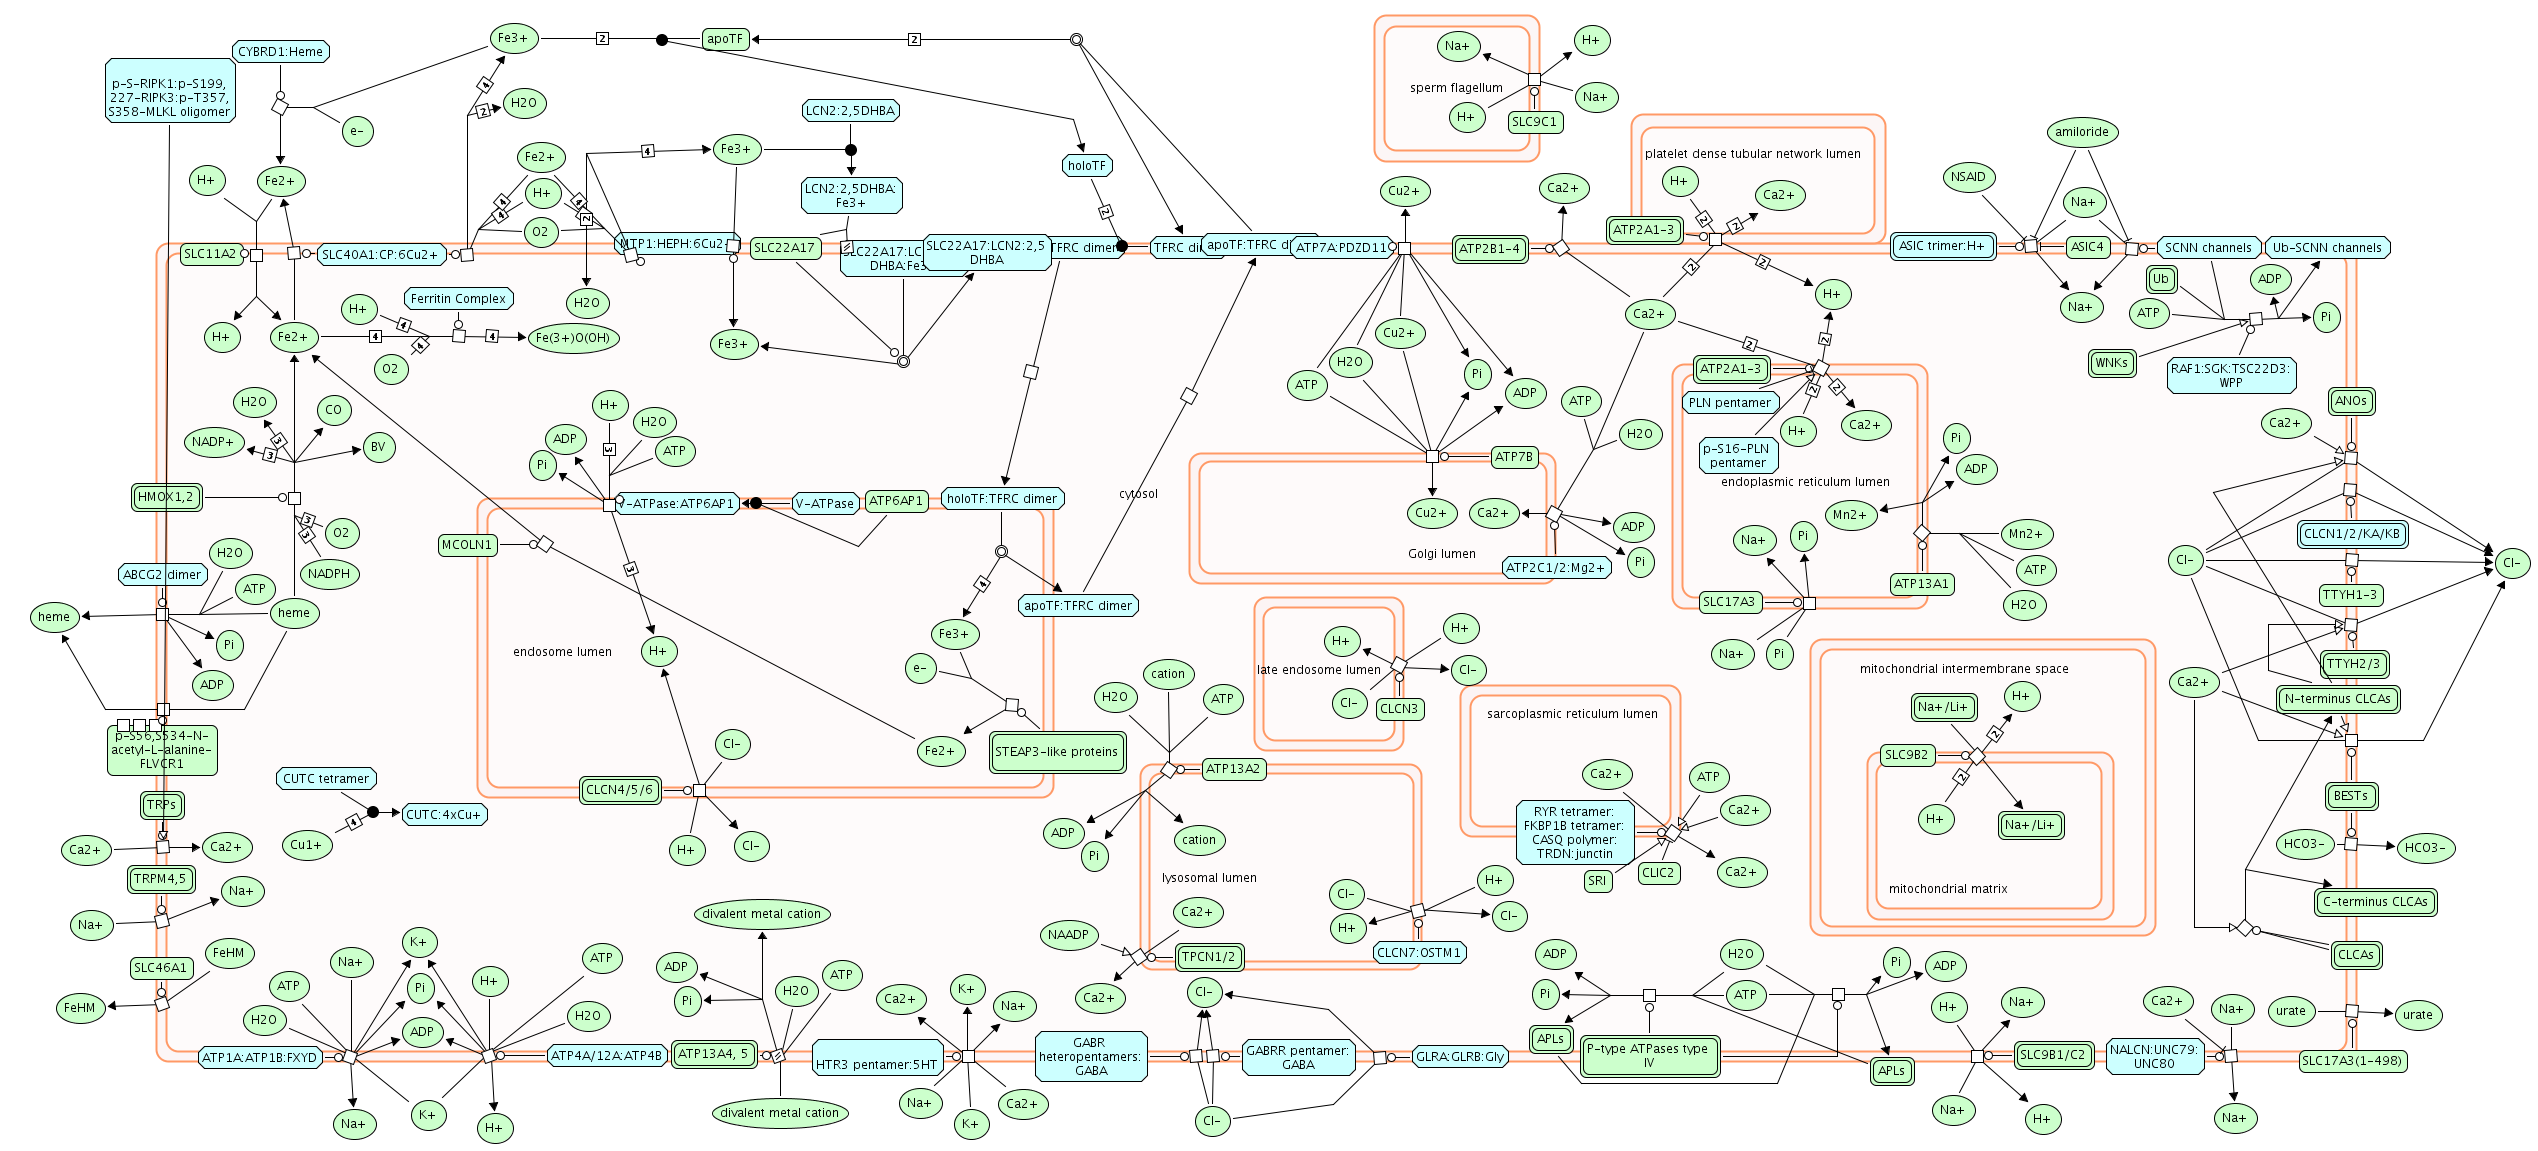
| Diagram of Transport of inorganic cations-anions and amino acids-oligopeptides, Defective SLC12A1 causes Bartter syndrome 1 (BS1), Defective SLC12A3 causes Gitelman syndrome (GS), Defective SLC12A6 causes agenesis of the corpus callosum, with peripher.png | 2025-05-14 17:00 | 587K | |
| Diagram of Transport of inorganic cations-anions amino acids-oligopeptides.png | 2025-05-14 16:55 | 587K | |
| Diagram of Transport of glycerol from adipocytes to the liver by Aquaporins.png | 2025-05-14 16:57 | 19K | |
| Diagram of Transport of glucose other sugars.png | 2025-05-14 16:56 | 456K | |
| Diagram of Transport of glucose and other sugars, bile salts and organic acids, metal ions and amine compounds, Defective RHAG causes regulator type Rh-null hemolytic anemia (RHN), Defective SLC16A1 causes symptomatic deficiency in lactate transport (.png | 2025-05-14 17:00 | 456K | |
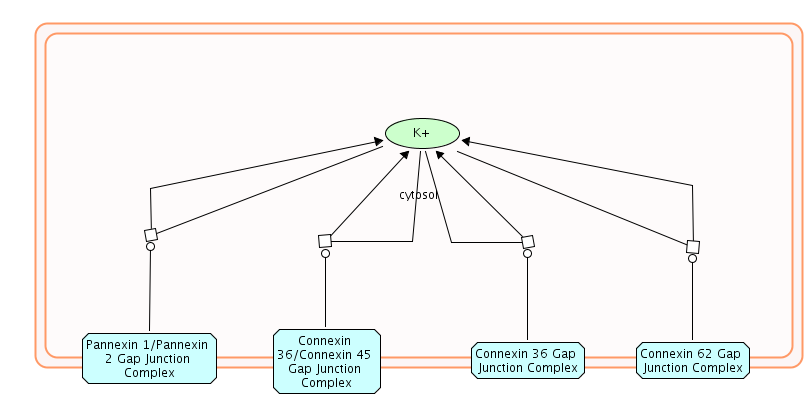
| Diagram of Transmission across Electrical Synapses .png | 2025-05-14 16:57 | 19K | |
| Diagram of Transmission across Chemical Synapses.png | 2025-05-14 16:57 | 14K | |
| Diagram of Transmembrane transport of small molecules.png | 2025-05-14 17:00 | 8.0K | |
| Diagram of Translocation of GLUT4 to the plasma membrane.png | 2025-05-14 17:00 | 156K | |
| Diagram of Translation.png | 2025-05-14 16:56 | 11K | |
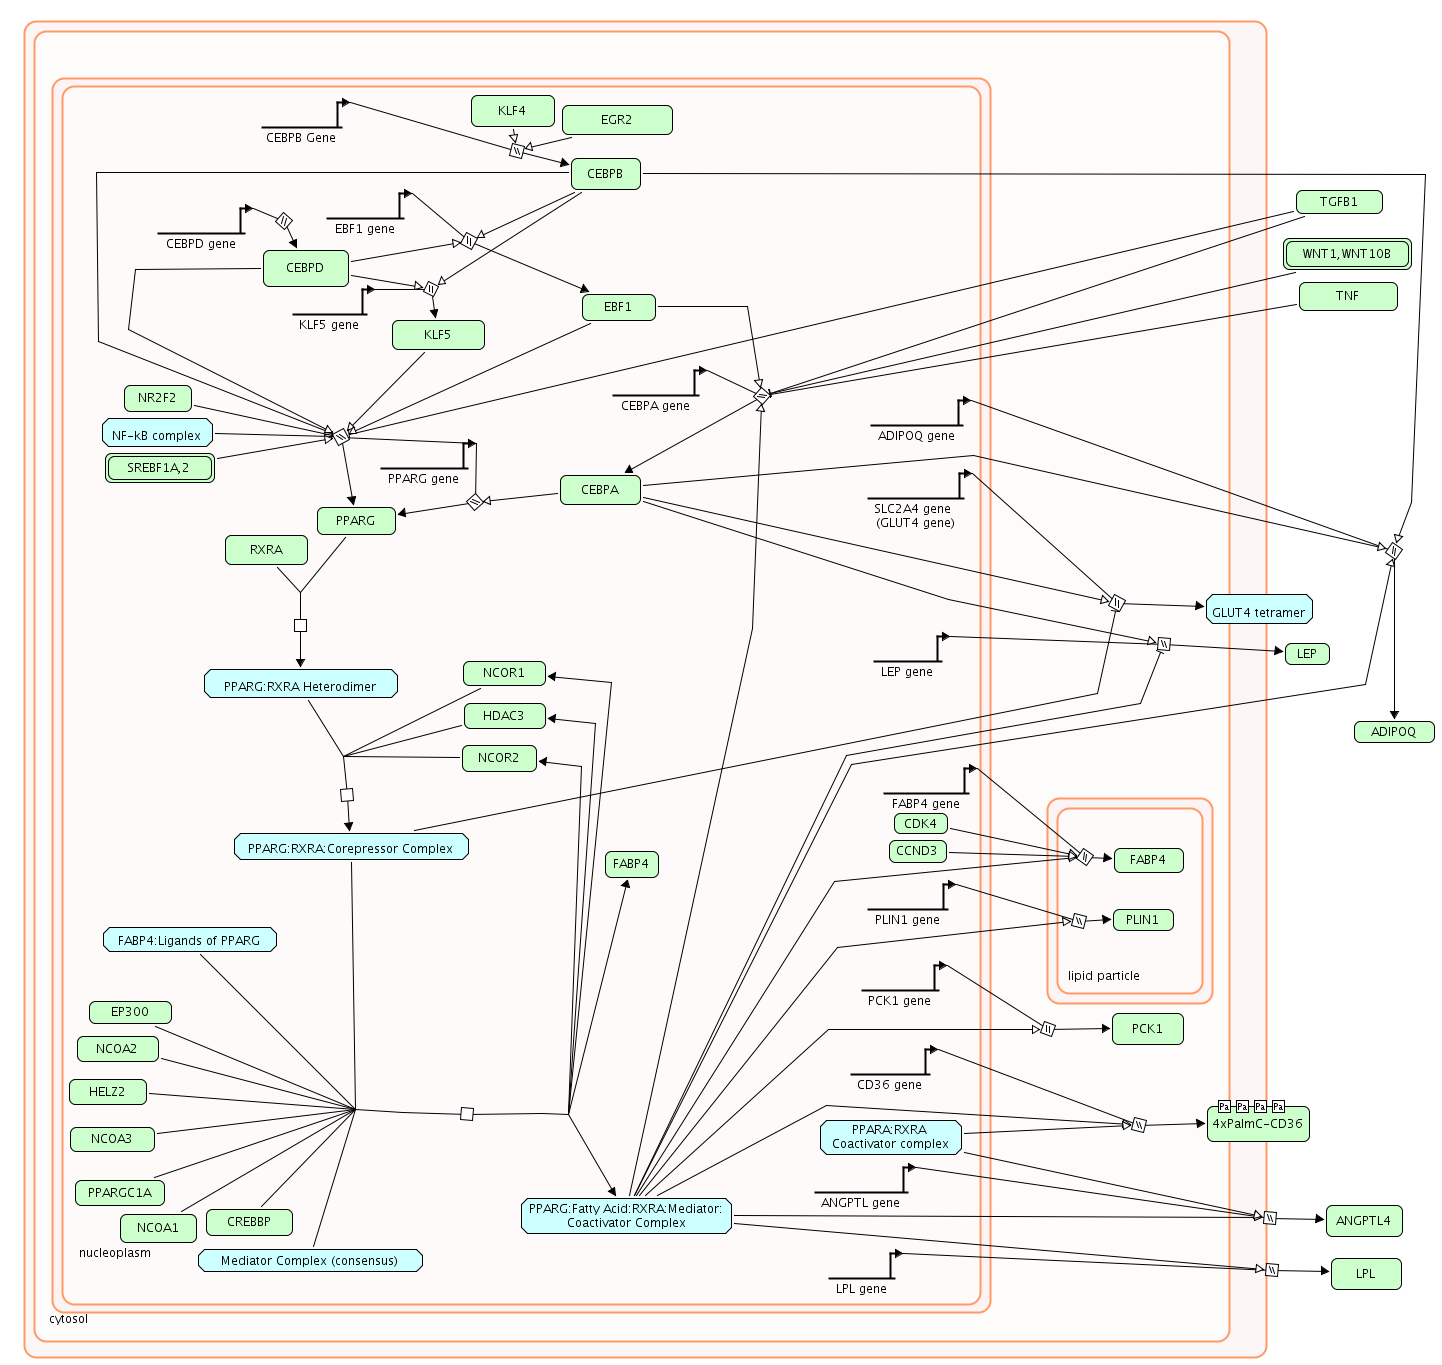
| Diagram of Transcriptional regulation of white adipocyte differentiation.png | 2025-05-14 17:00 | 226K | |
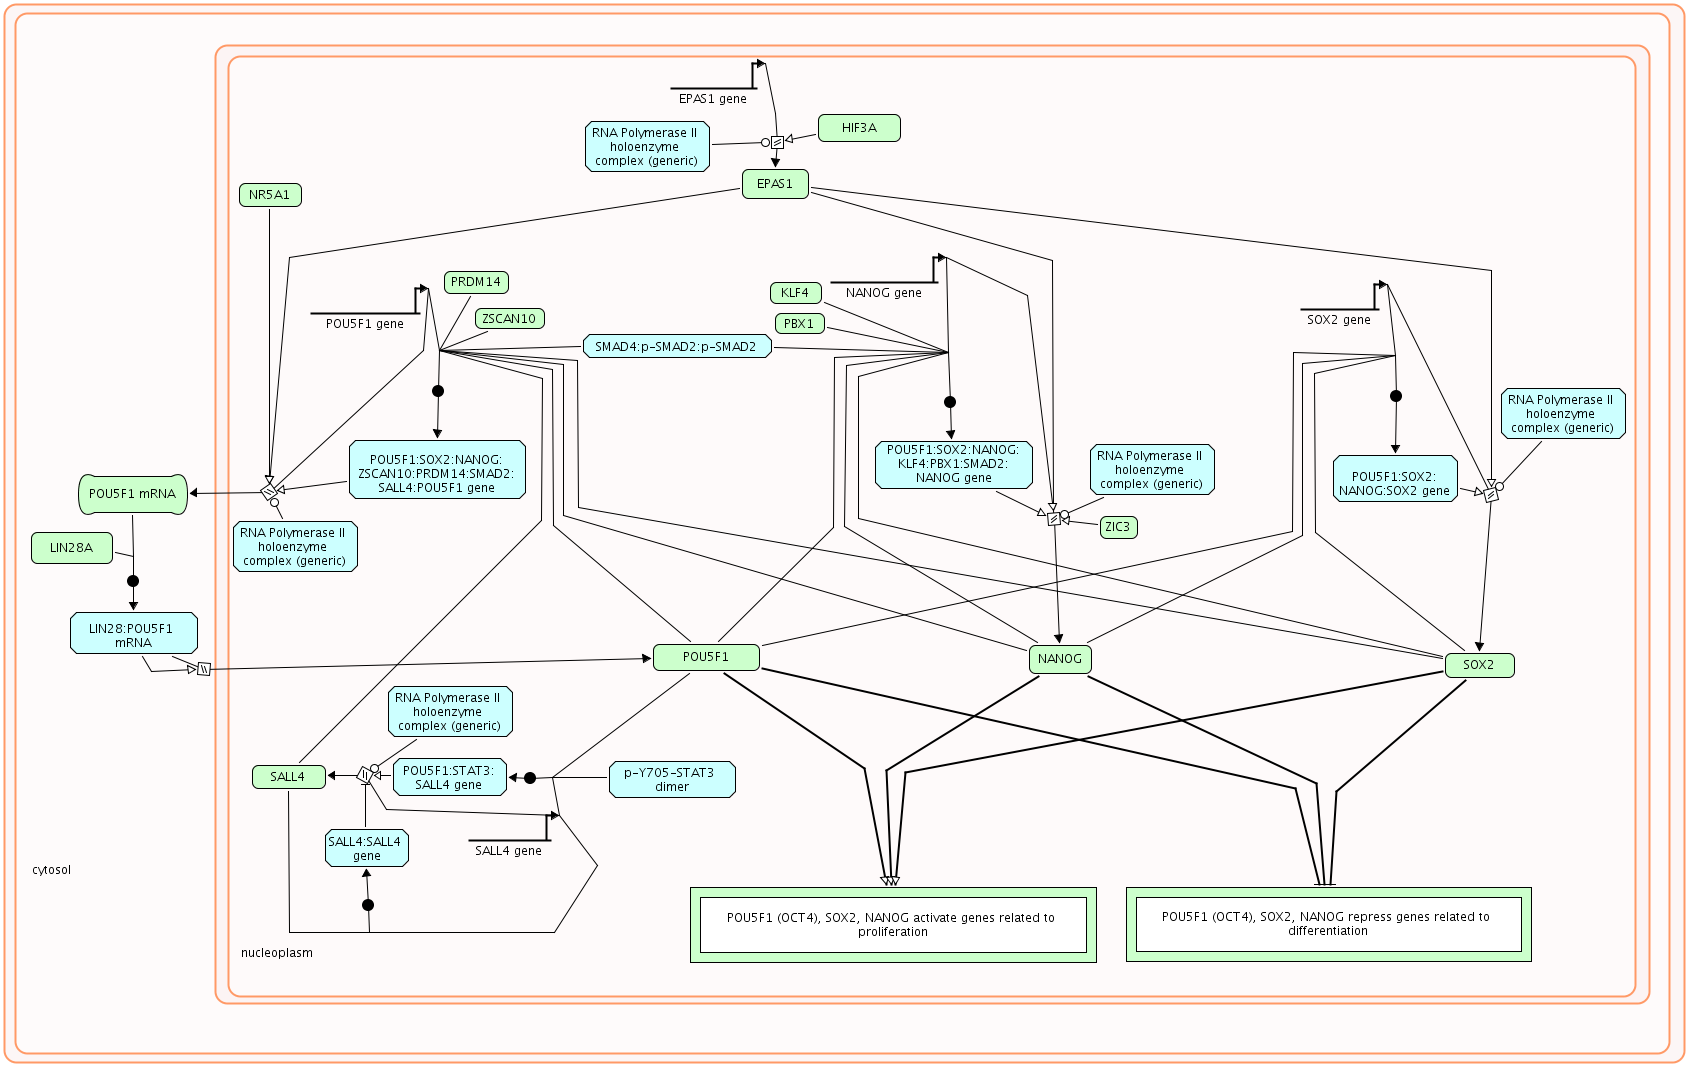
| Diagram of Transcriptional regulation of pluripotent stem cells.png | 2025-05-14 17:00 | 162K | |
| Diagram of Transcriptional activity of SMAD2-SMAD3_SMAD4 heterotrimer.png | 2025-05-14 16:58 | 203K | |
| Diagram of Transcriptional Regulation by TP53.png | 2025-05-14 16:57 | 8.6K | |
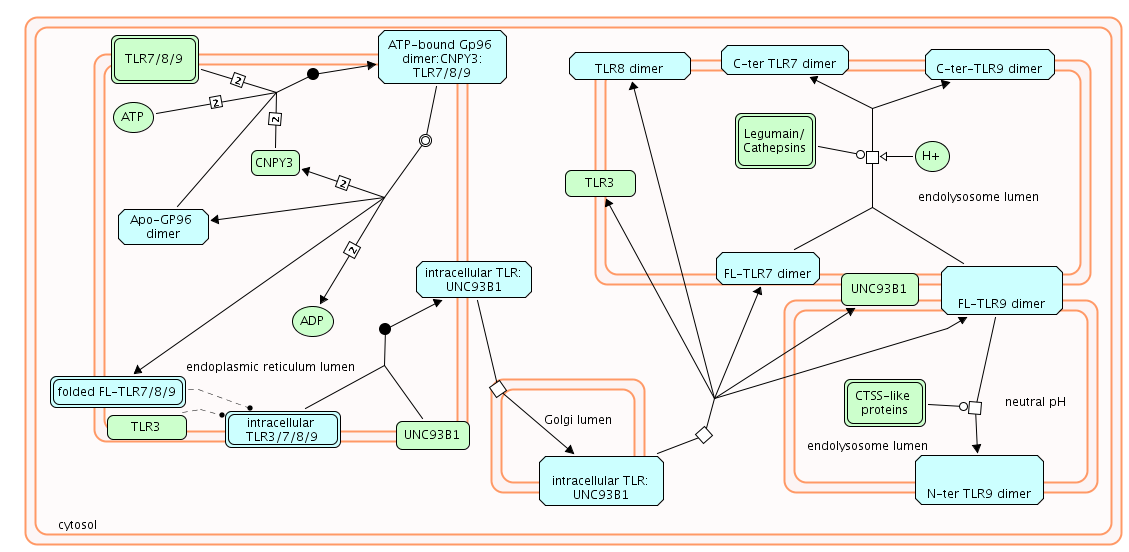
| Diagram of Trafficking and processing of endosomal TLR and UNC93B1 deficiency - HSE.png | 2025-05-14 16:57 | 66K | |
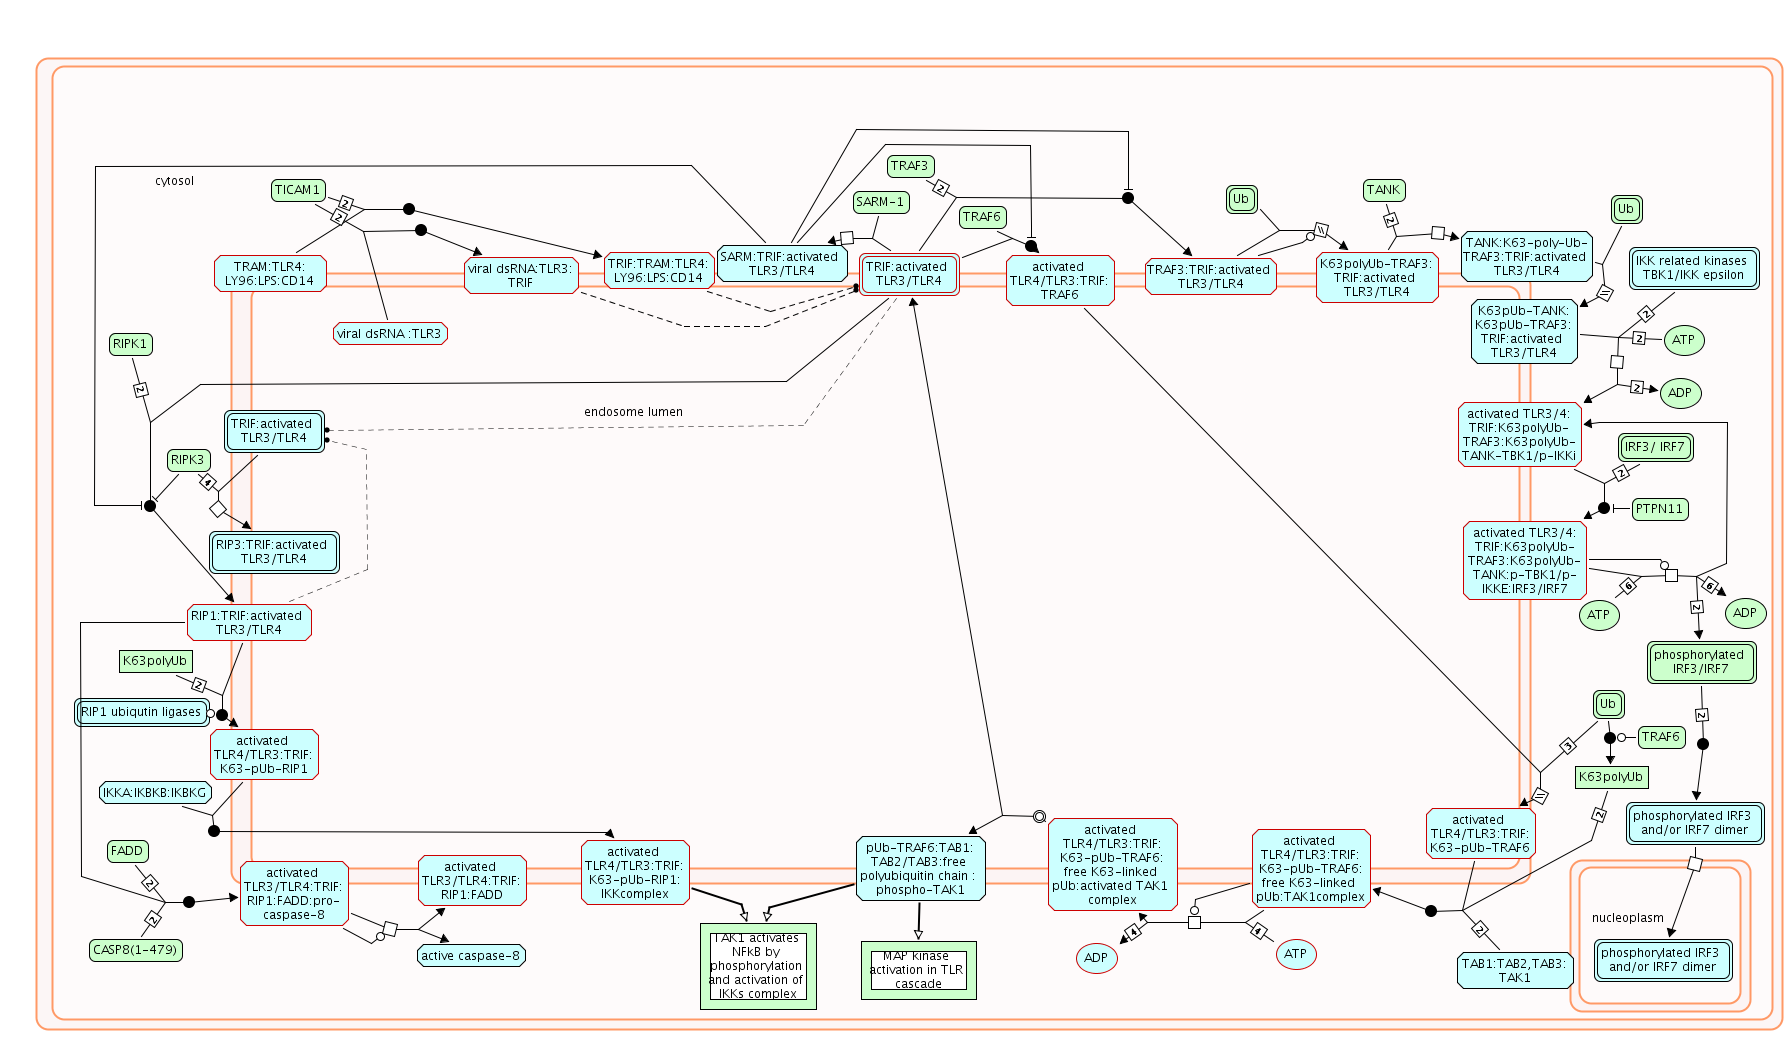
| Diagram of Toll Like Receptor 3 (TLR3) Cascade and TLR3 deficiency - HSE.png | 2025-05-14 16:56 | 14K | |
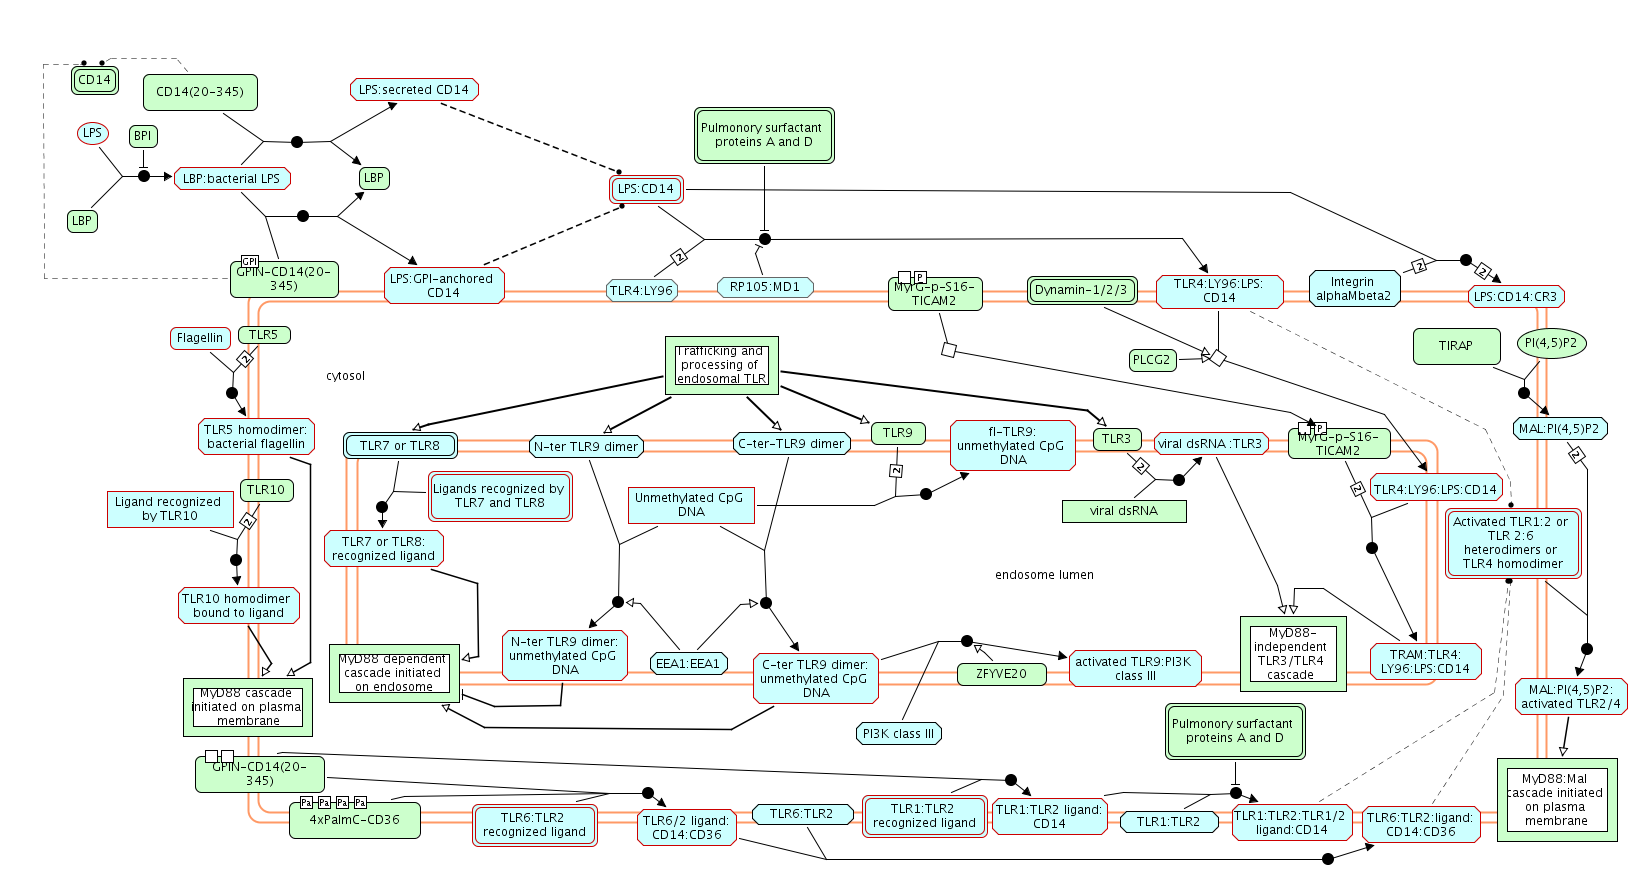
| Diagram of Toll-Like Receptors Cascades.png | 2025-05-14 16:58 | 152K | |
| Diagram of Thrombin signalling through proteinase activated receptors (PARs).png | 2025-05-14 16:57 | 83K | |
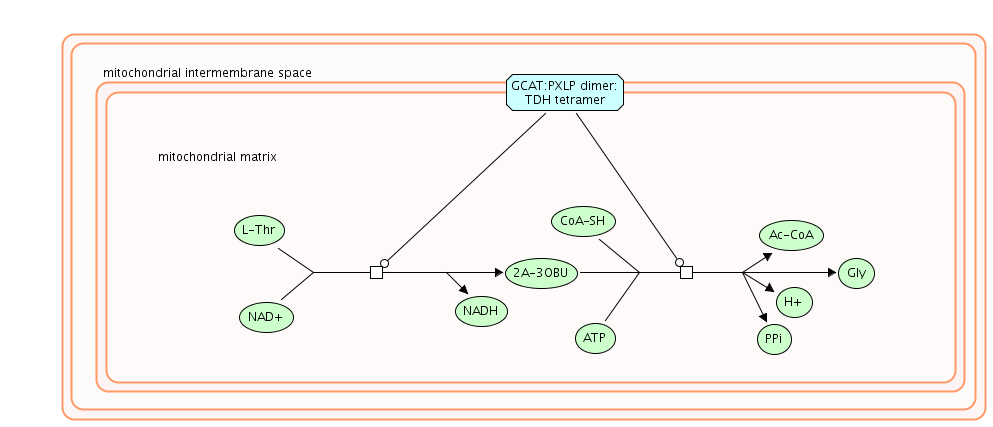
| Diagram of Threonine catabolism.png | 2025-05-14 16:58 | 27K | |
| Diagram of The citric acid (TCA) cycle and respiratory electron transport.png | 2025-05-14 16:57 | 284K | |
| Diagram of The Neuronal System.png | 2025-05-14 16:56 | 9.5K | |
| Diagram of The Immune System.png | 2025-05-14 16:56 | 6.3K | |
| Diagram of Telomere Maintenance.png | 2025-05-14 16:59 | 176K | |
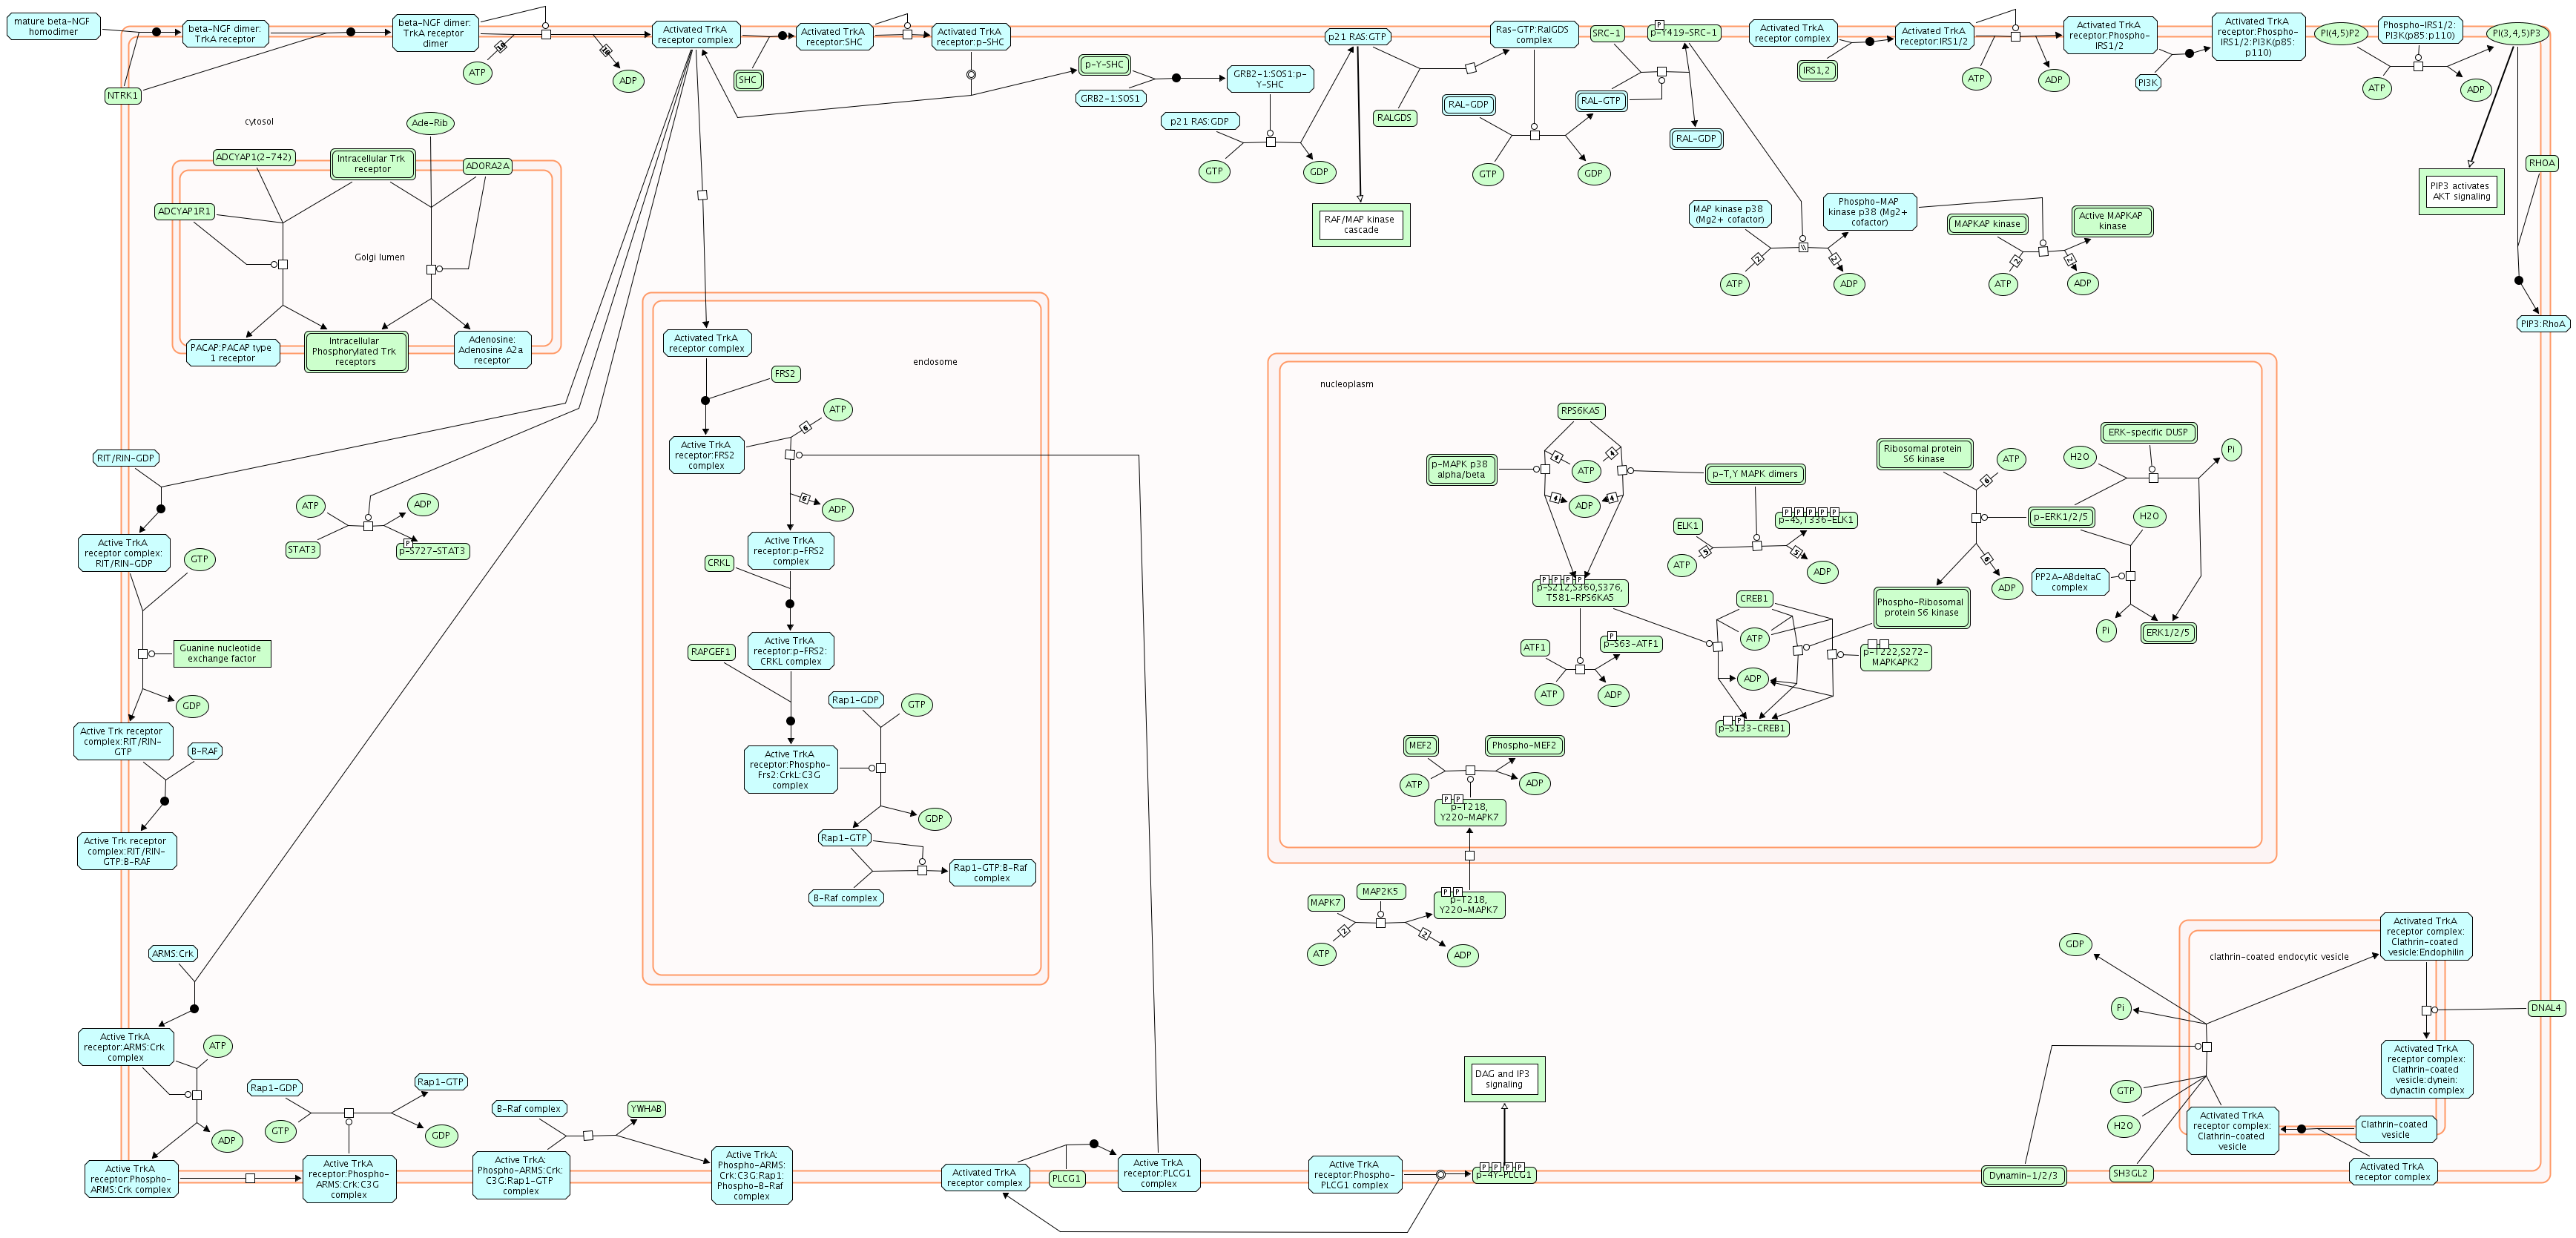
| Diagram of TRKA signalling from the plasma membrane.png | 2025-05-14 17:01 | 397K | |
| Diagram of TRAIL signaling.png | 2025-05-14 16:59 | 39K | |
| Diagram of TRAF3 deficiency - HSE.png | 2025-05-14 16:57 | 167K | |
| Diagram of TP53 Regulates Transcription of DNA Repair Genes.png | 2025-05-14 17:00 | 114K | |
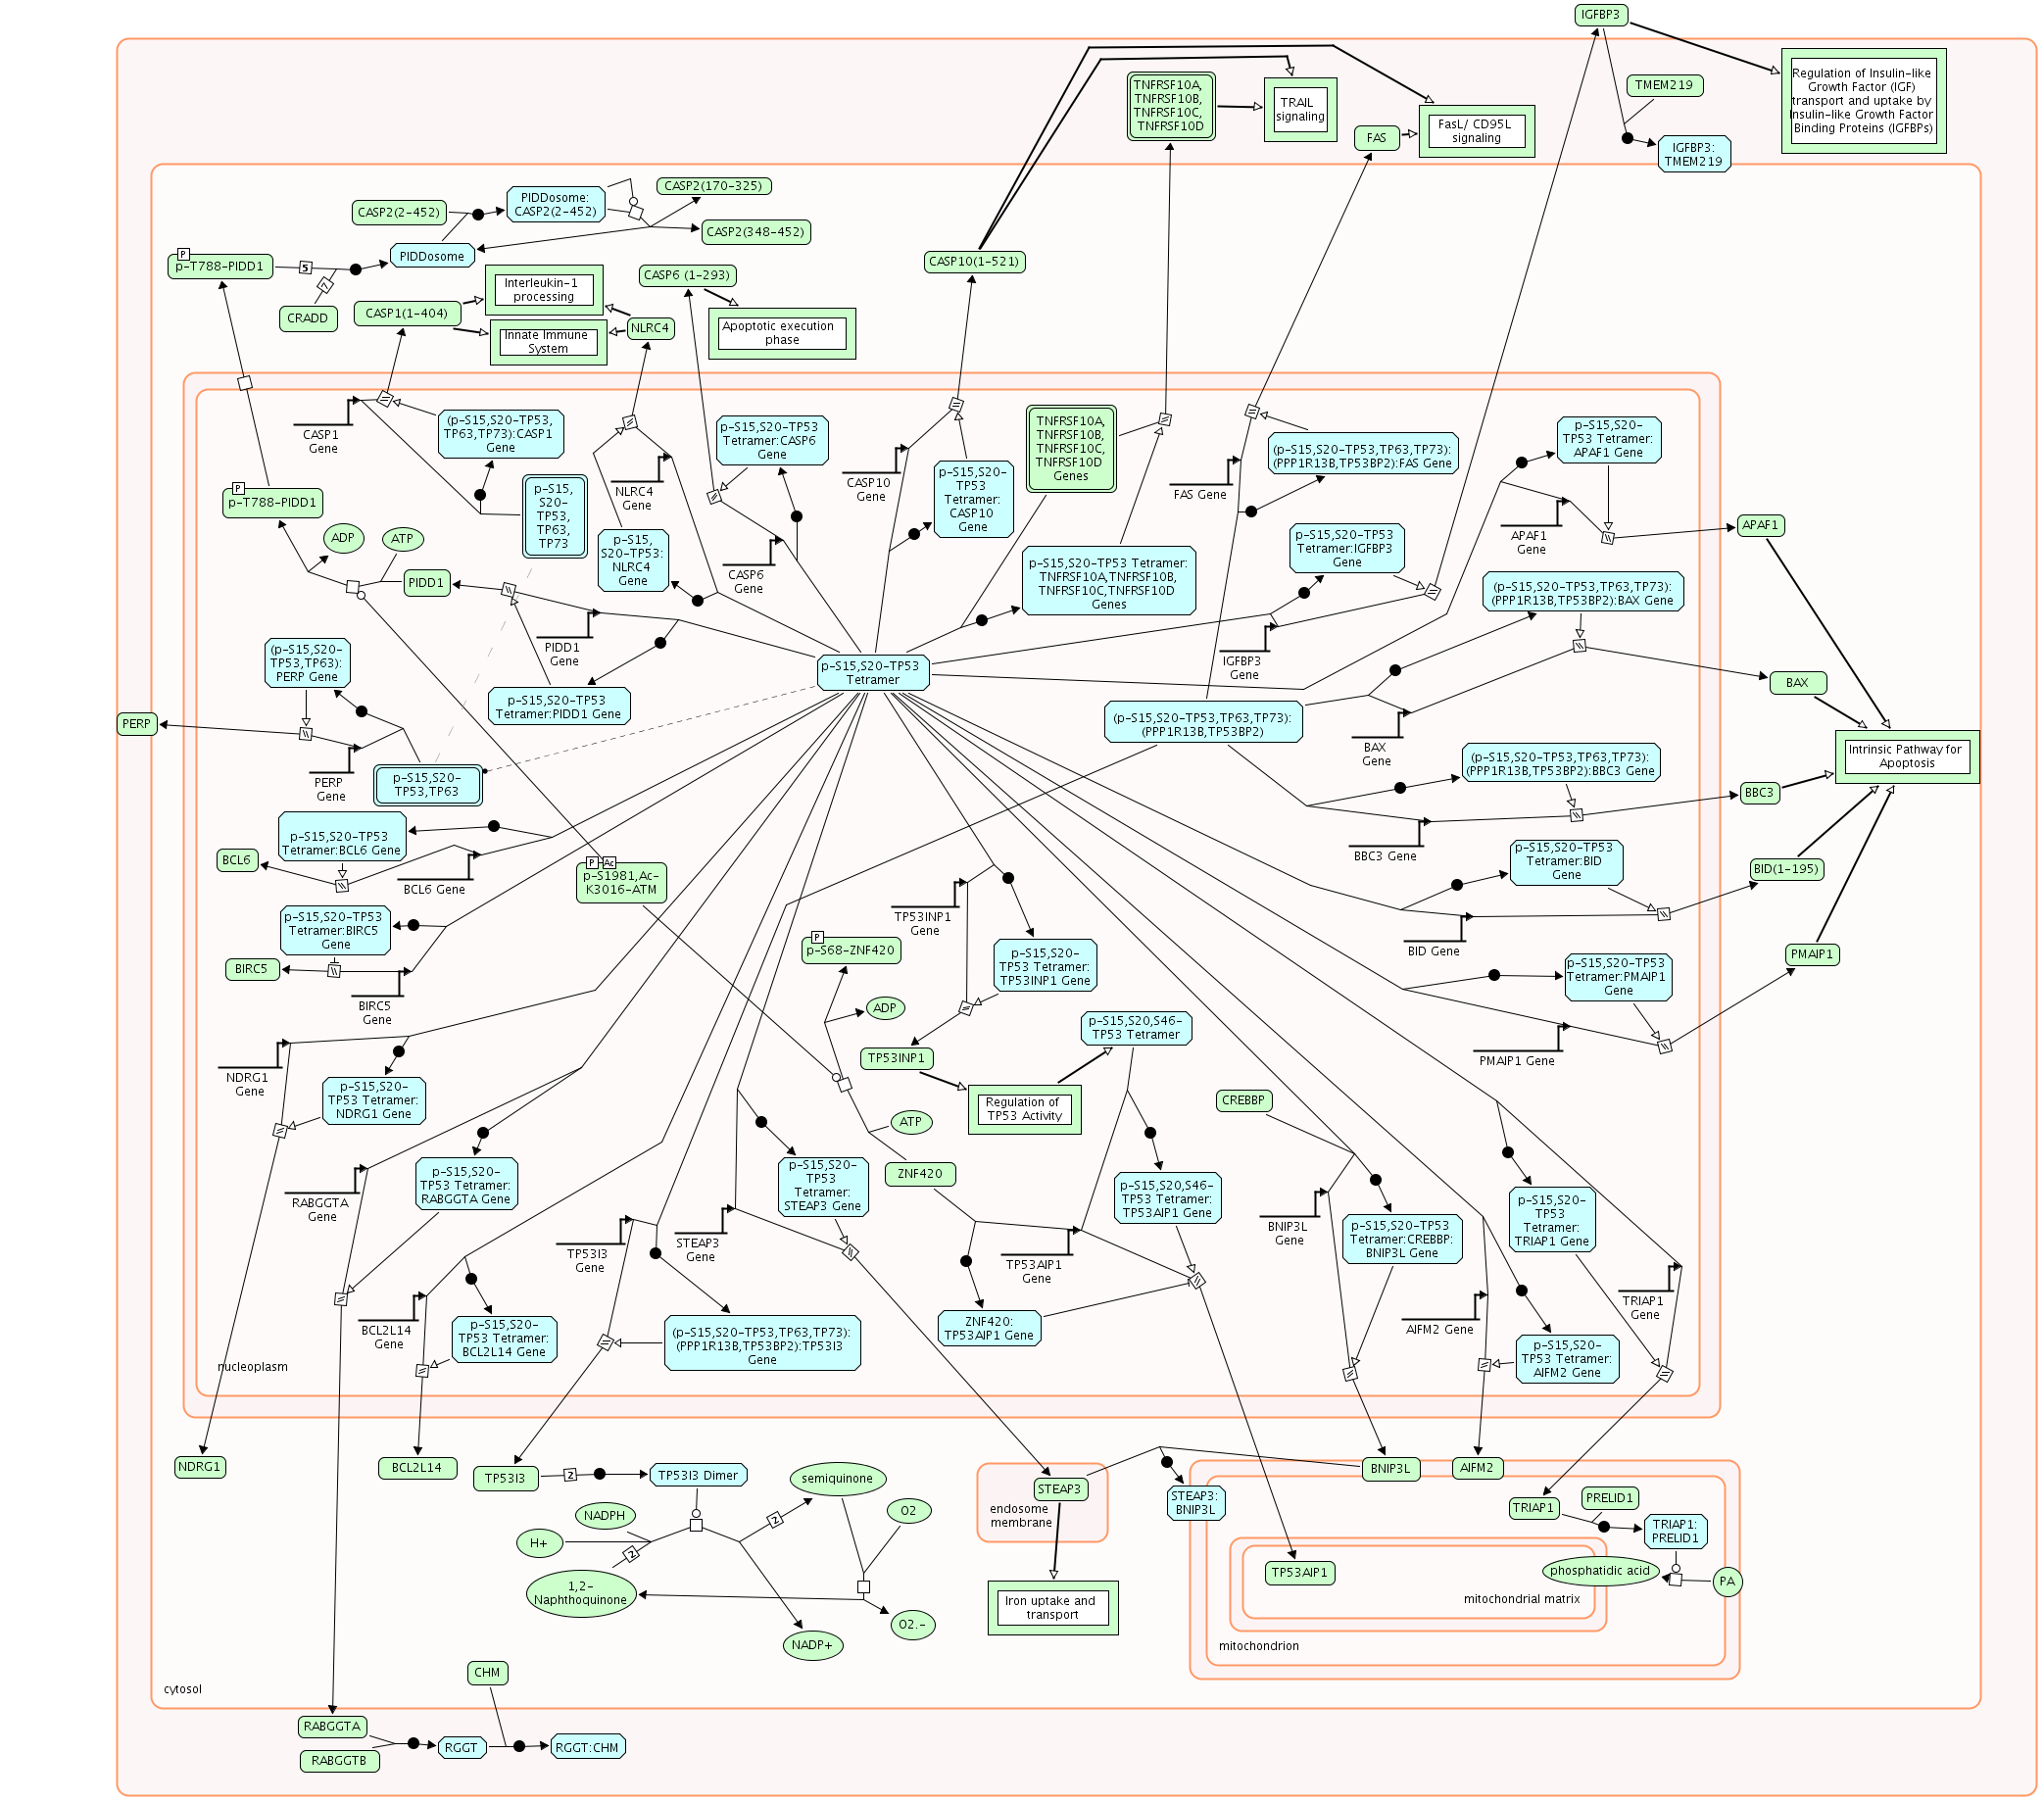
| Diagram of TP53 Regulates Transcription of Cell Death Genes.png | 2025-05-14 17:00 | 431K | |
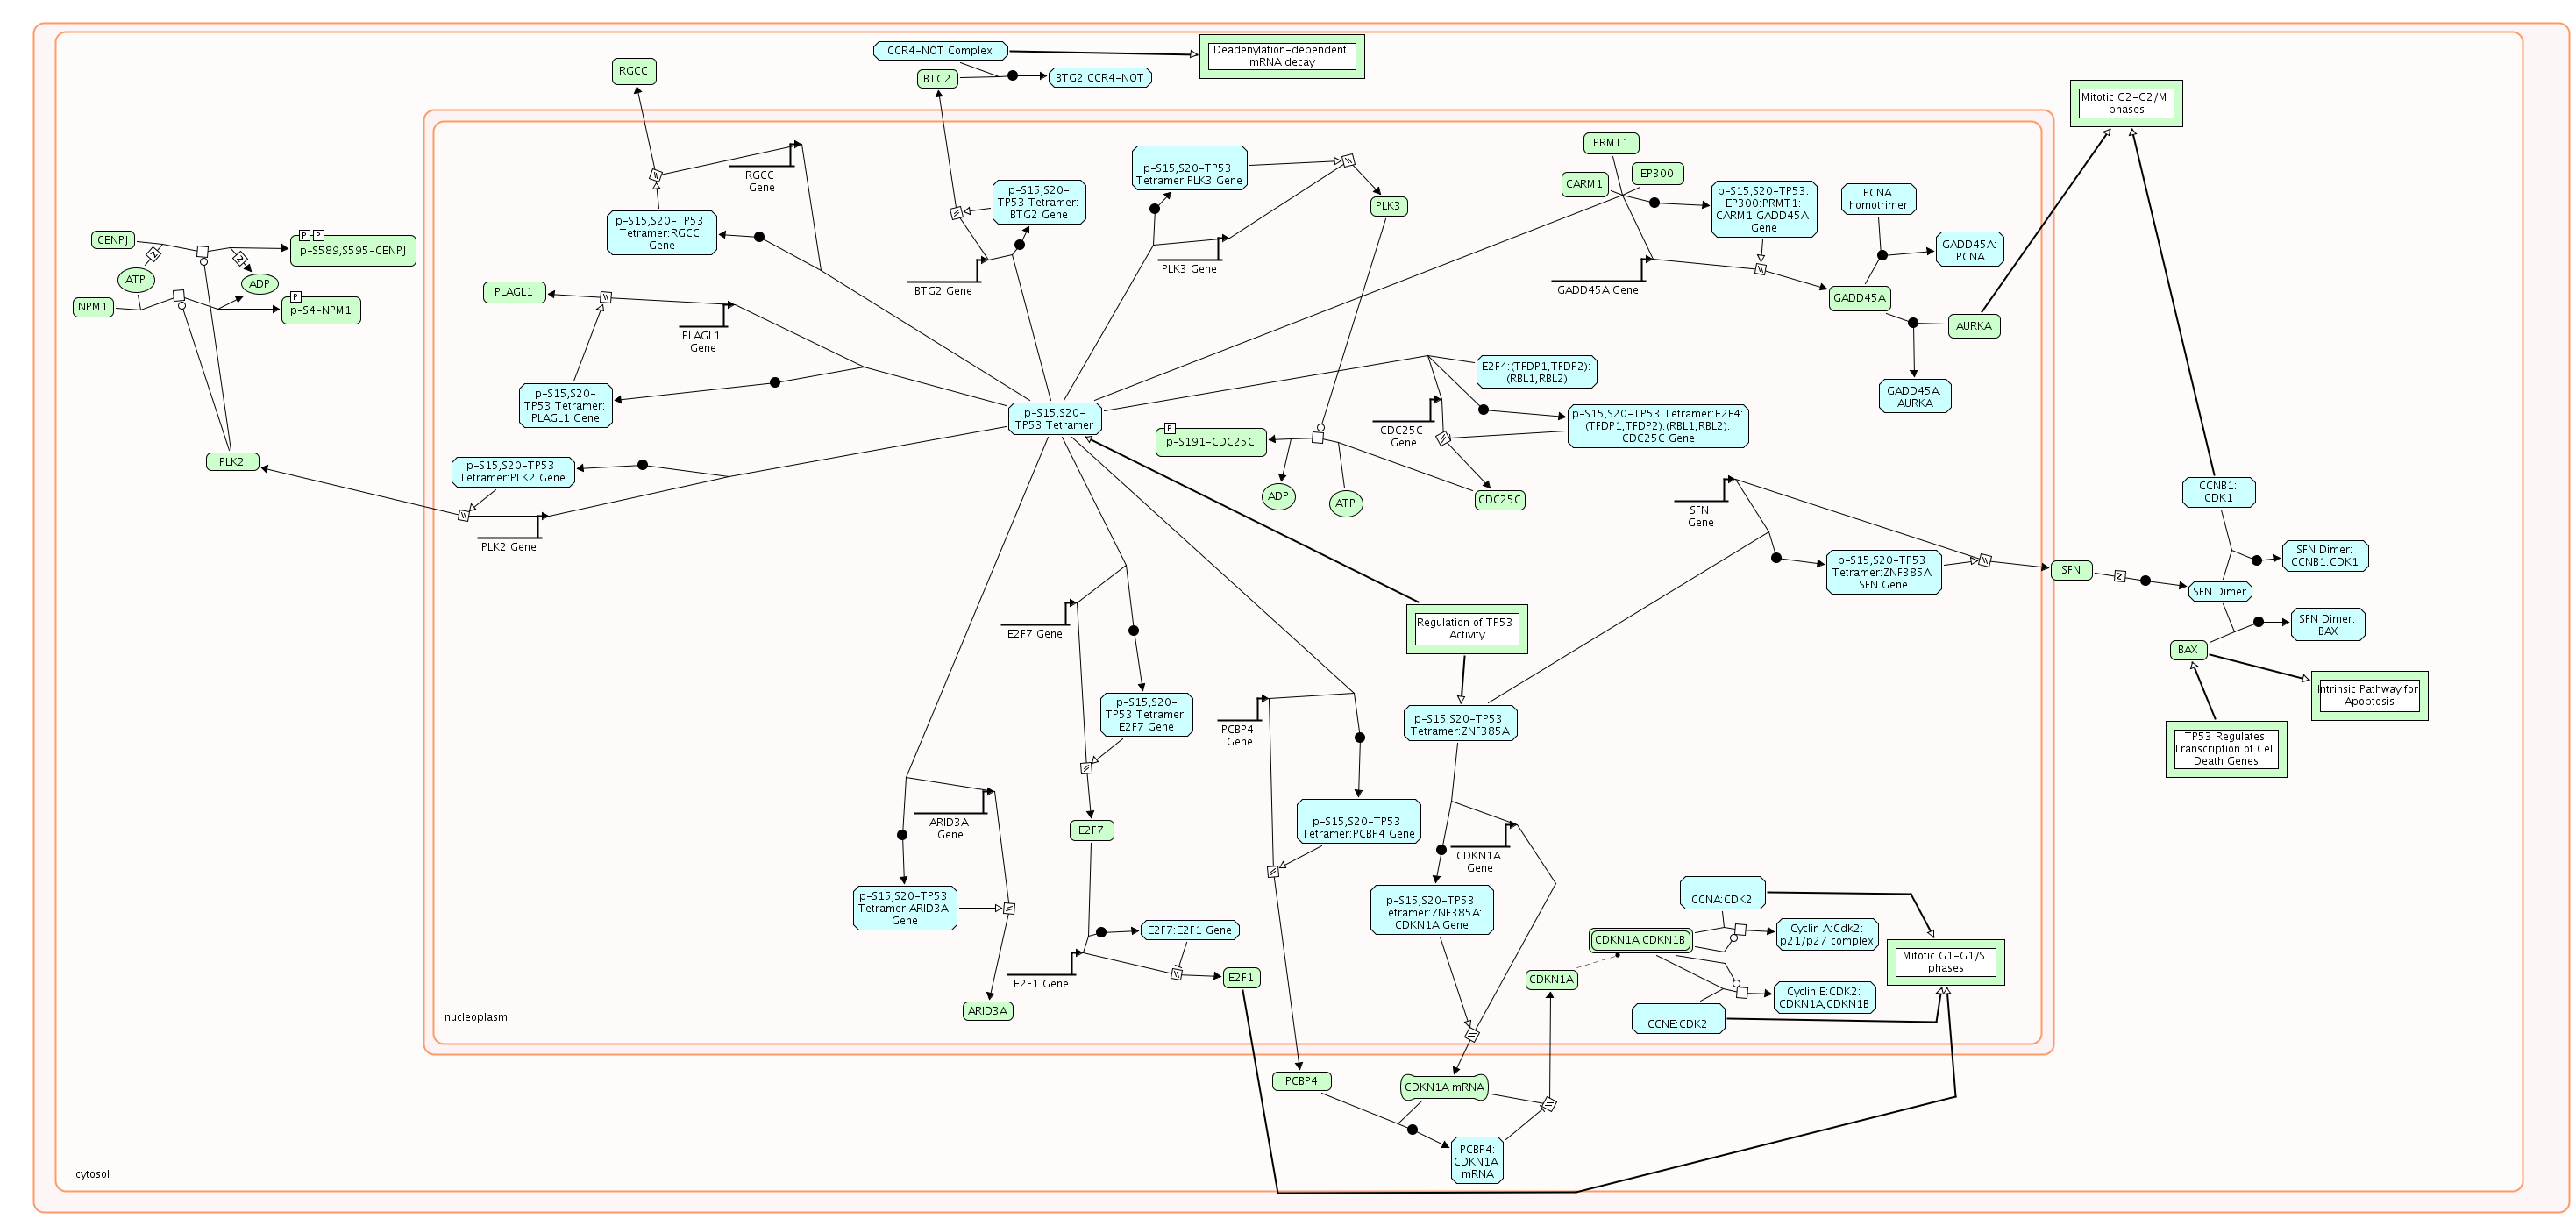
| Diagram of TP53 Regulates Transcription of Cell Cycle Genes.png | 2025-05-14 16:55 | 263K | |
| Diagram of TP53 Regulates Metabolic Genes.png | 2025-05-14 17:00 | 250K | |
| Diagram of TNF signaling.png | 2025-05-14 16:59 | 222K | |
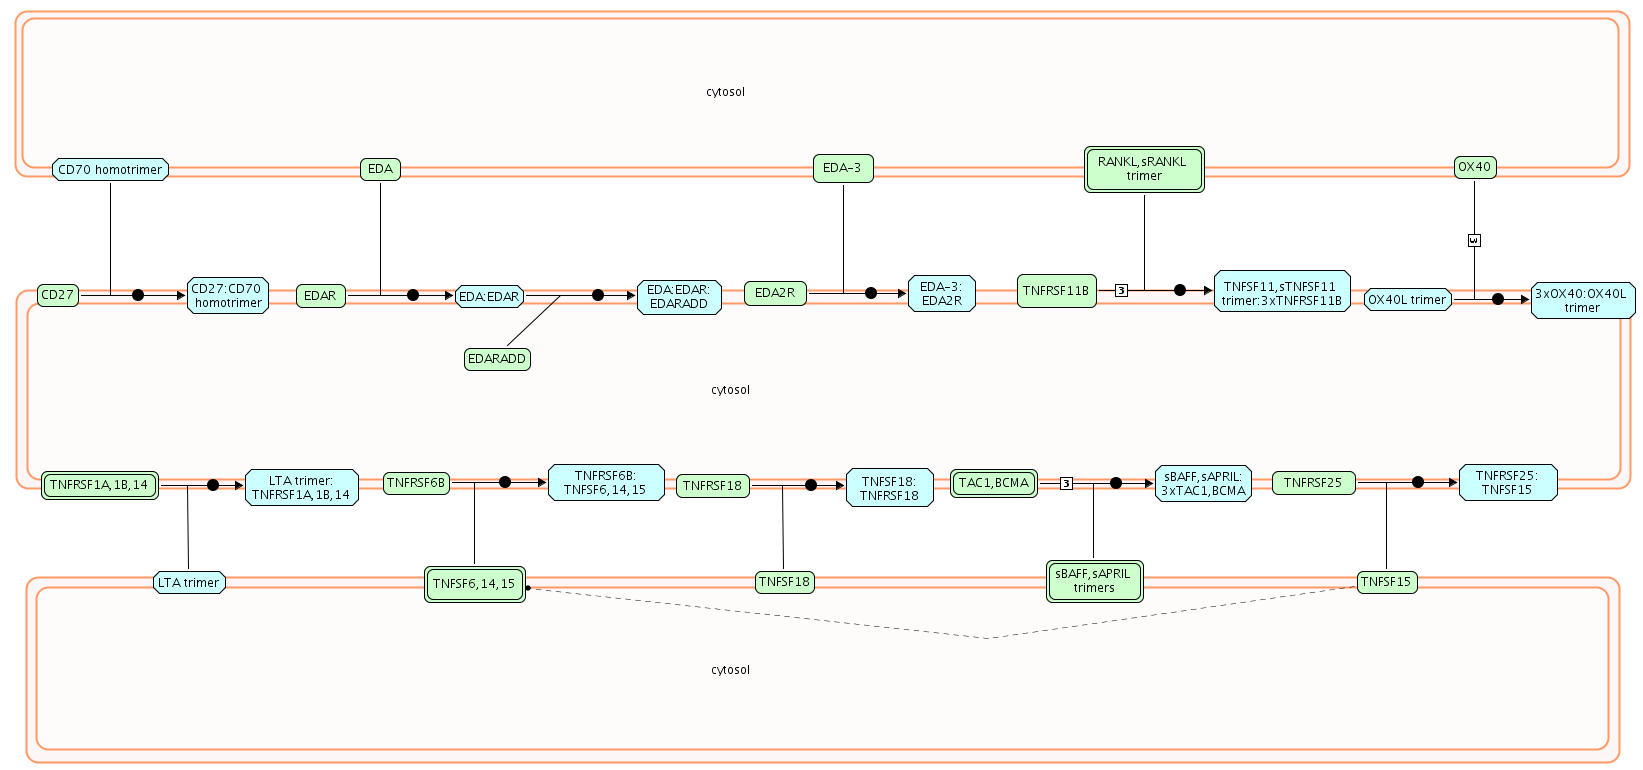
| Diagram of TNFs.png | 2025-05-14 16:58 | 41K | |
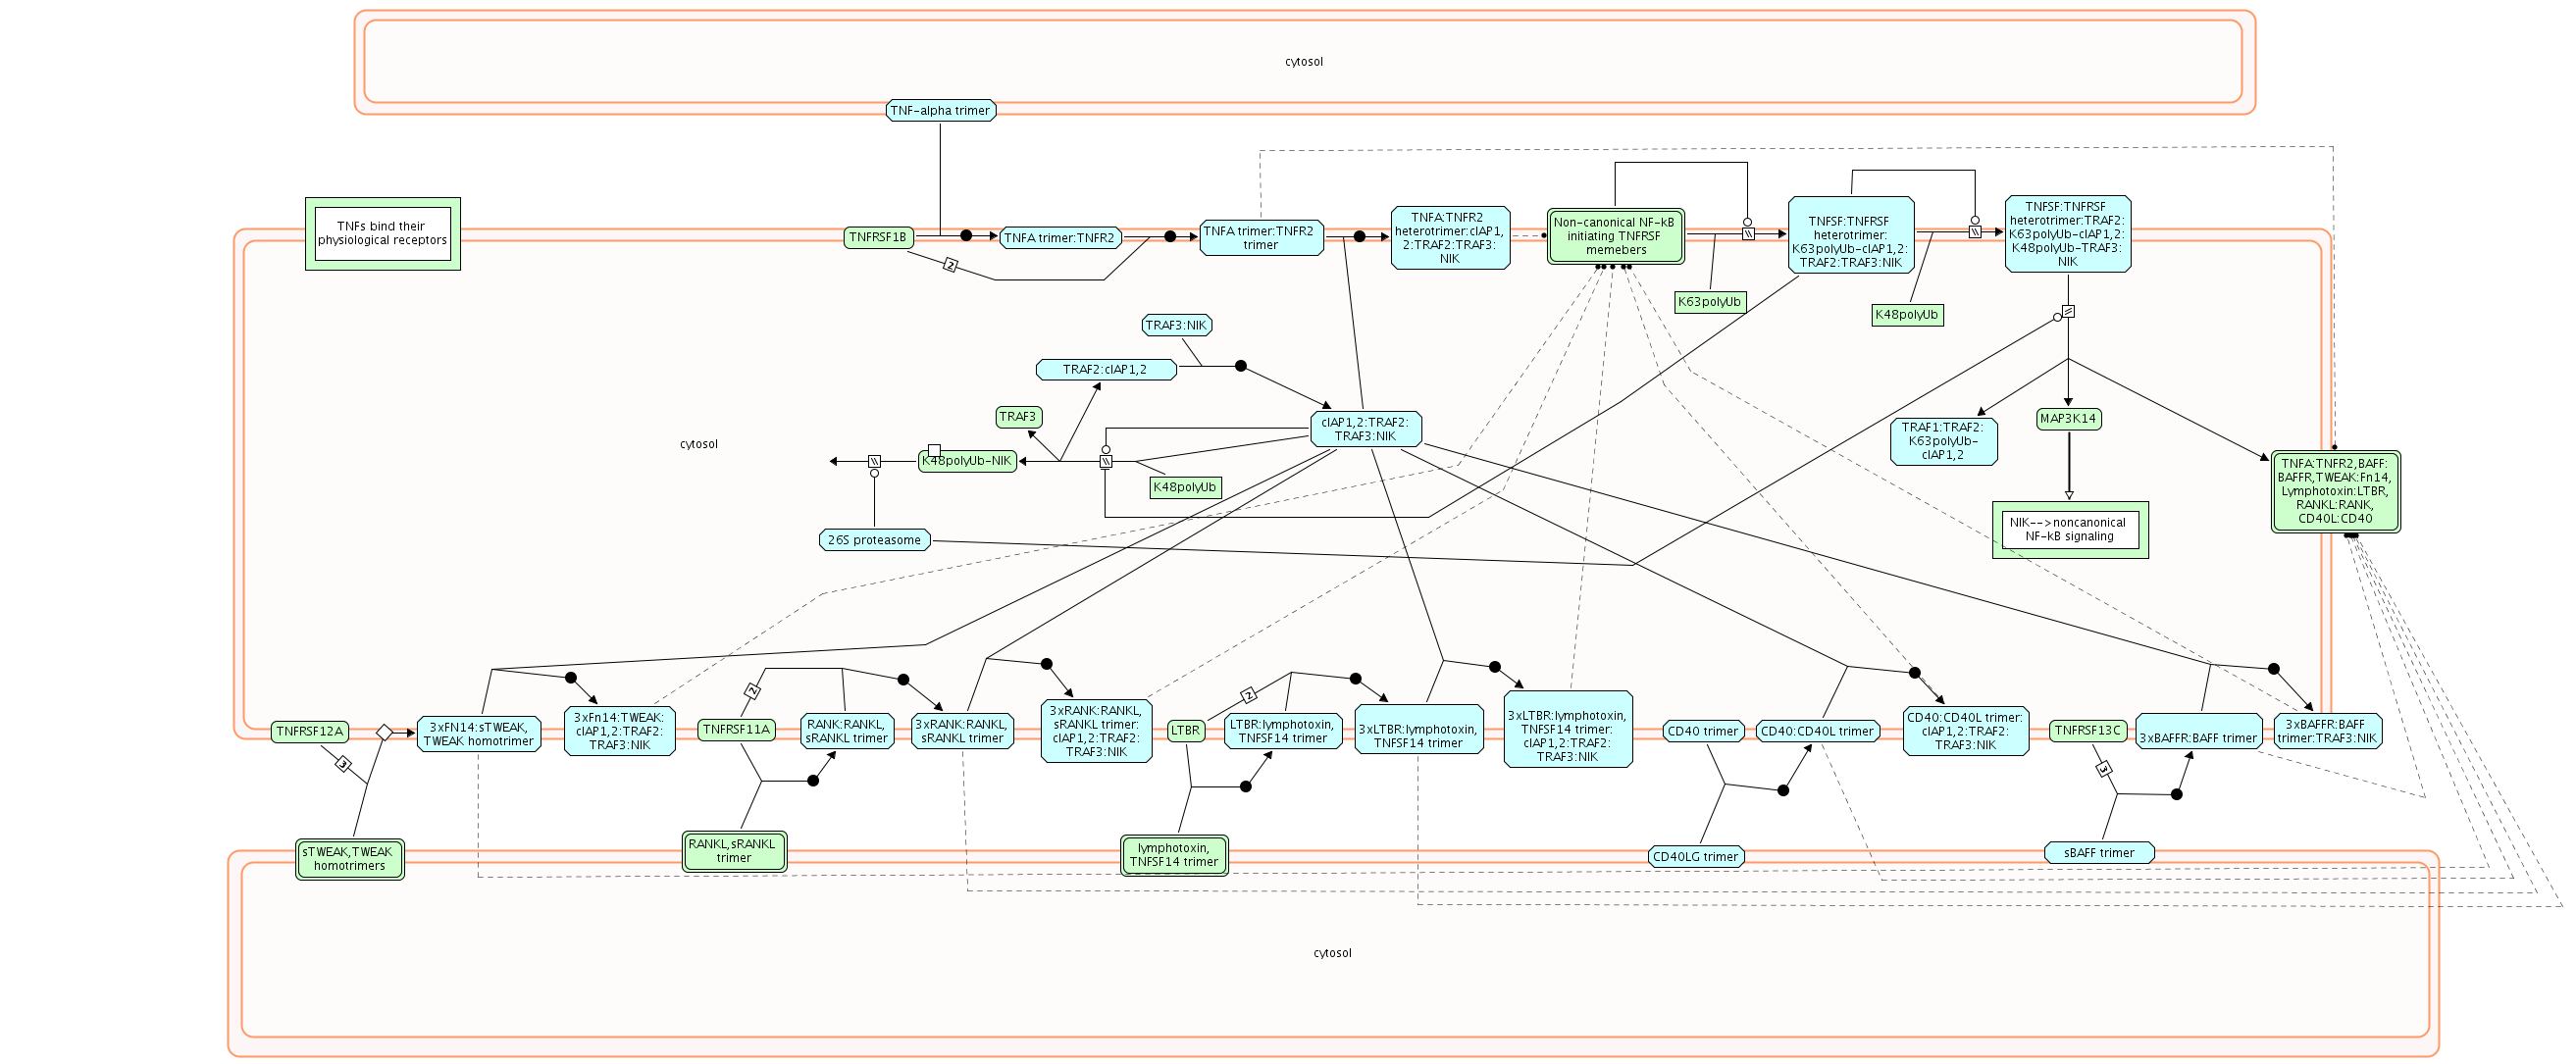
| Diagram of TNFRSF mediated non-canonical NF-kB pathway.png | 2025-05-14 17:00 | 159K | |
| Diagram of TICAM1 deficiency - HSE.png | 2025-05-14 17:00 | 167K | |
| Diagram of TGFBR2 MSI Frameshift Mutants in Cancer.png | 2025-05-14 16:57 | 242K | |
| Diagram of TGFBR2 Kinase Domain Mutants in Canc.png | 2025-05-14 16:59 | 242K | |
| Diagram of TET1,2,3 and TDG demethylate DNA.png | 2025-05-14 16:58 | 70K | |
| Diagram of TCR signaling.png | 2025-05-14 16:57 | 356K | |
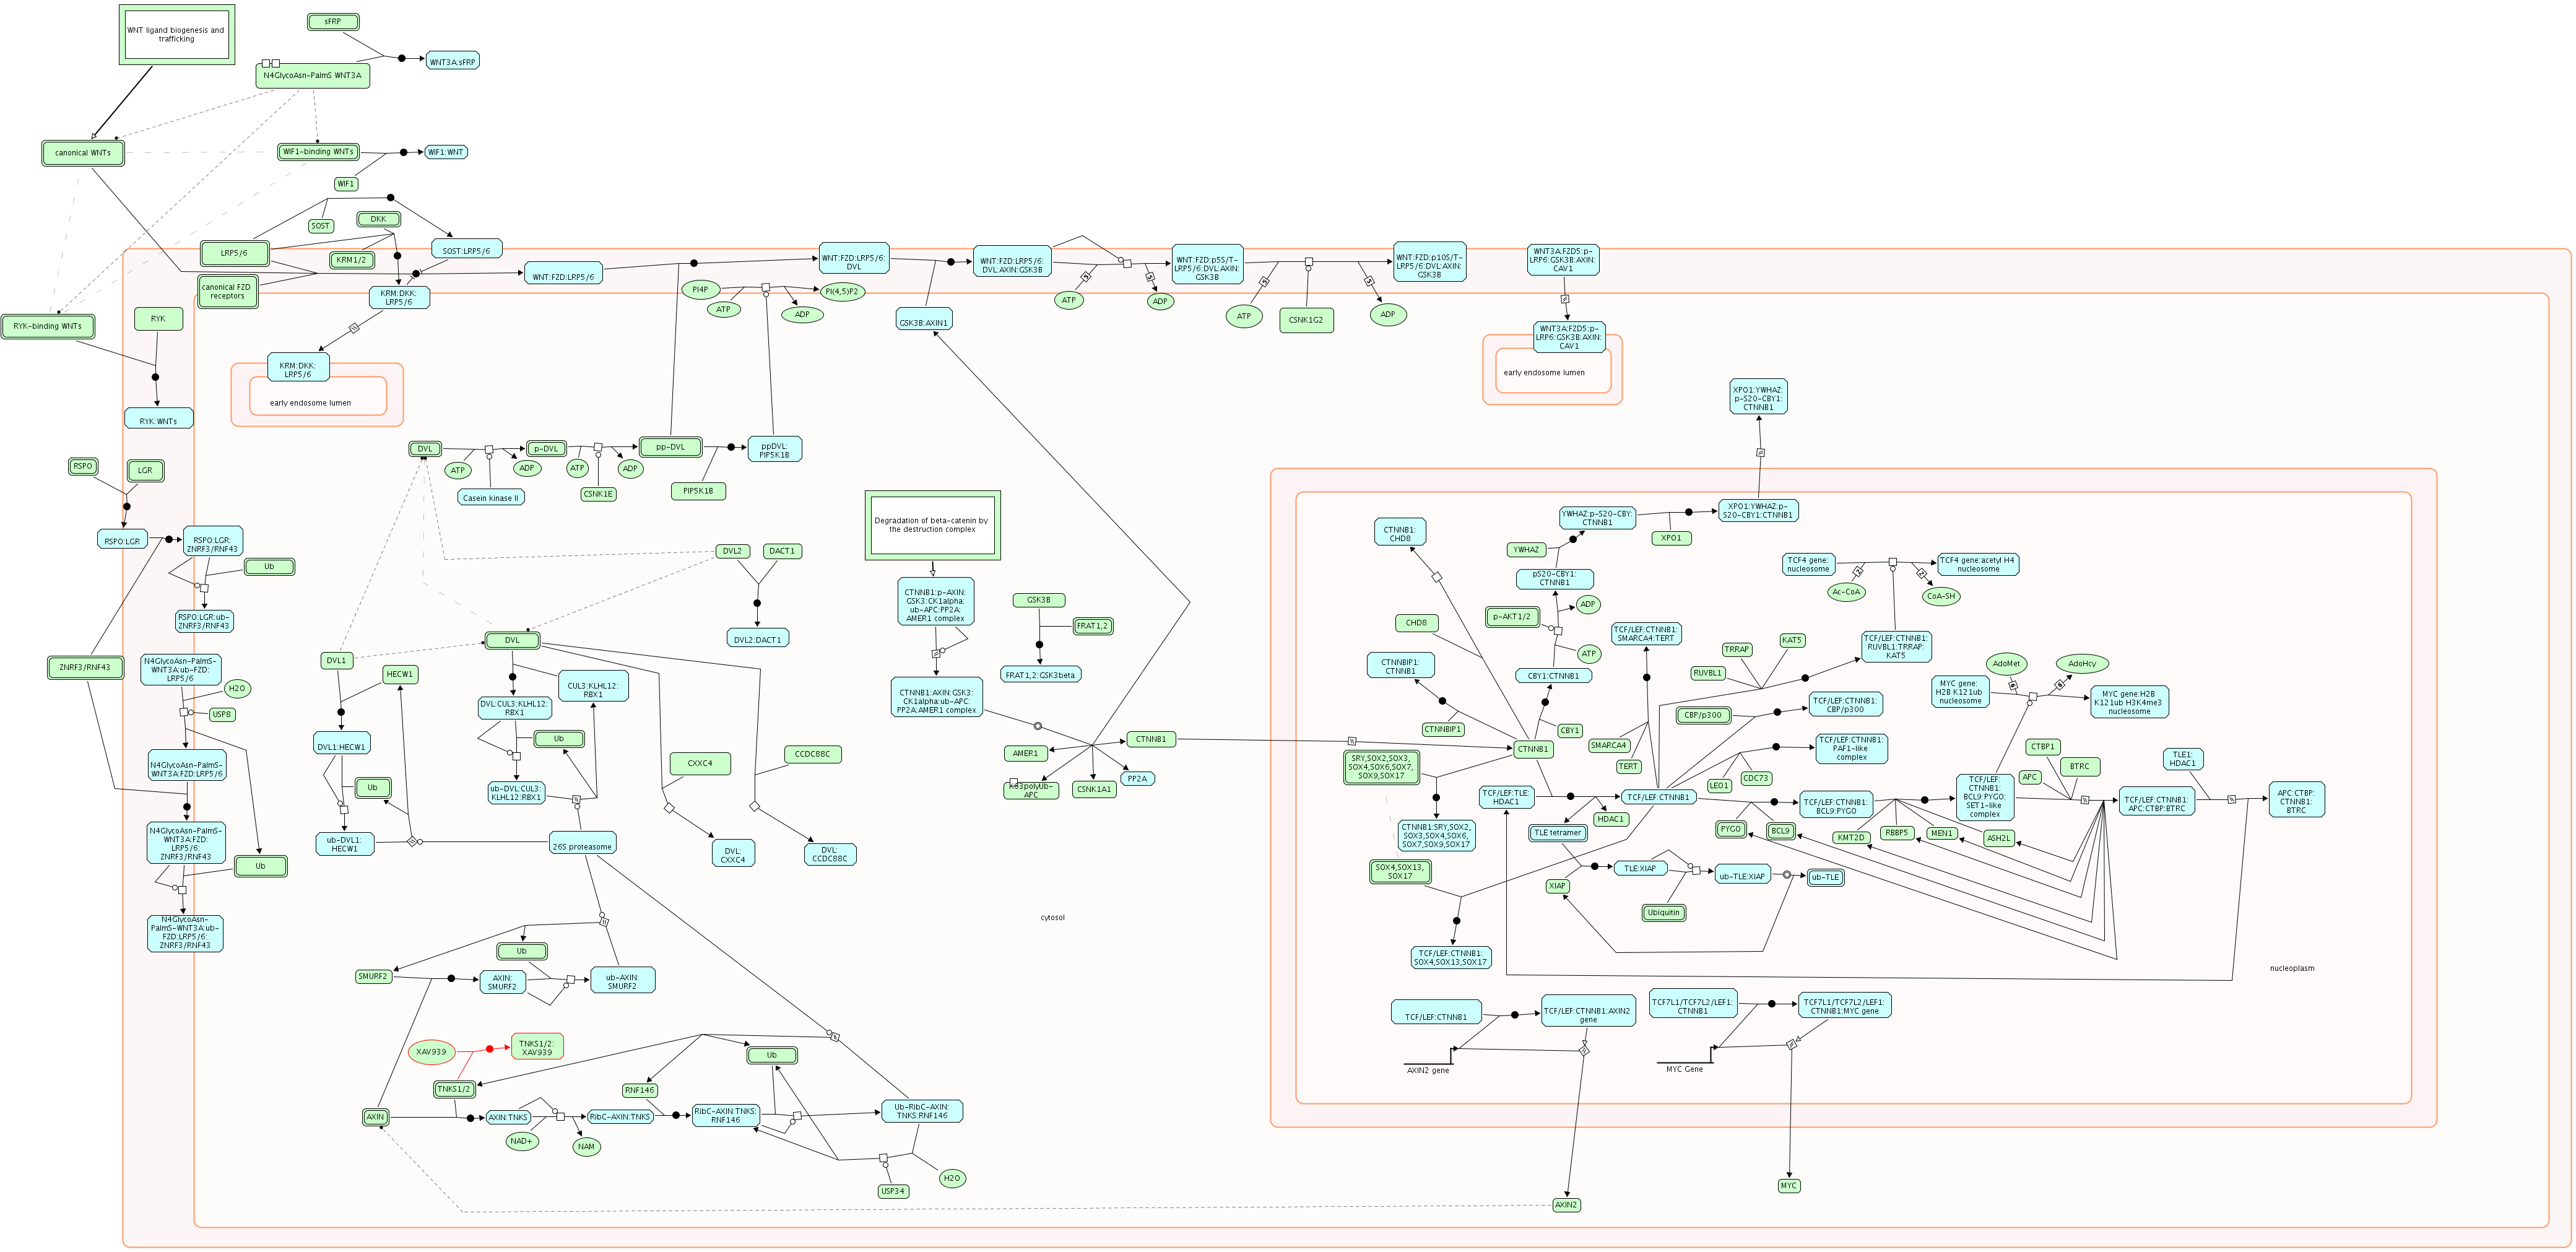
| Diagram of TCF dependent signaling in response to WNT.png | 2025-05-14 17:00 | 492K | |
| Diagram of TCF dependent signaling in response to WNT, Misspliced LRP5 mutants have enhanced beta-catenin-dependent signaling, RNF mutants show enhanced WNT signaling and proliferation, and XAV939 inhibits tankyrase, stabilizing AXIN.png | 2025-05-14 16:57 | 492K | |
| Diagram of TCF7L2 mutants don't bind CTBP.png | 2025-05-14 16:59 | 148K | |
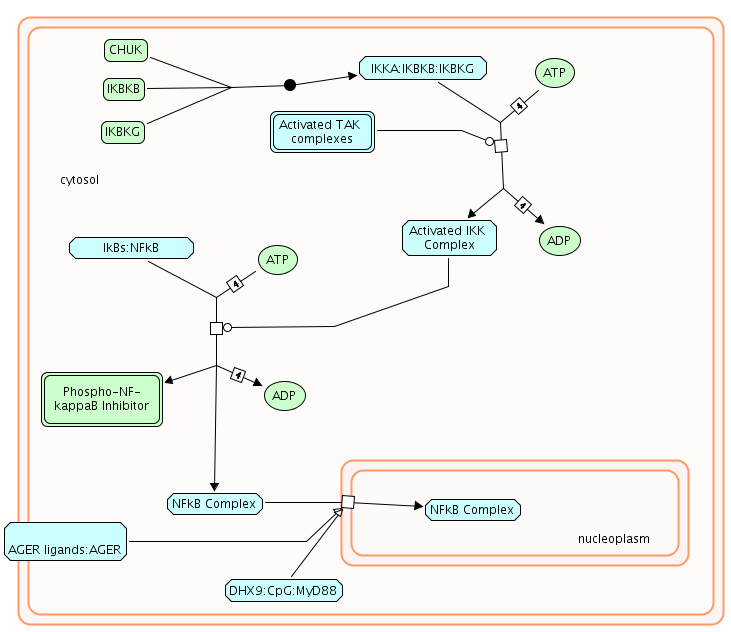
| Diagram of TAK1 activates NFkB by phosphorylation and activation of IKKs complex, IKBKB deficiency causes SCID, IkBA variant leads to EDA-ID, and IKBKG deficiency causes anhidrotic ectodermal dysplasia with immunodeficiency (EDA-ID) (via TLR).png | 2025-05-14 16:58 | 34K | |
| Diagram of TAK1 activates NFkB by phosphorylation activation of IKKs complex.png | 2025-05-14 16:59 | 34K | |
| Diagram of T41 mutants of beta-catenin aren't phosphorylated.png | 2025-05-14 16:58 | 148K | |
| Diagram of Synthesis of wybutosine at G37 of tRNA(Phe).png | 2025-05-14 16:57 | 99K | |
| Diagram of Synthesis of DNA.png | 2025-05-14 16:59 | 159K | |
| Diagram of Synthesis.png | 2025-05-14 17:00 | 74K | |
| Diagram of Synthesis, secretion, and deacylation of Ghrelin.png | 2025-05-14 16:59 | 74K | |
| Diagram of Syndecan interactions.png | 2025-05-14 16:56 | 88K | |
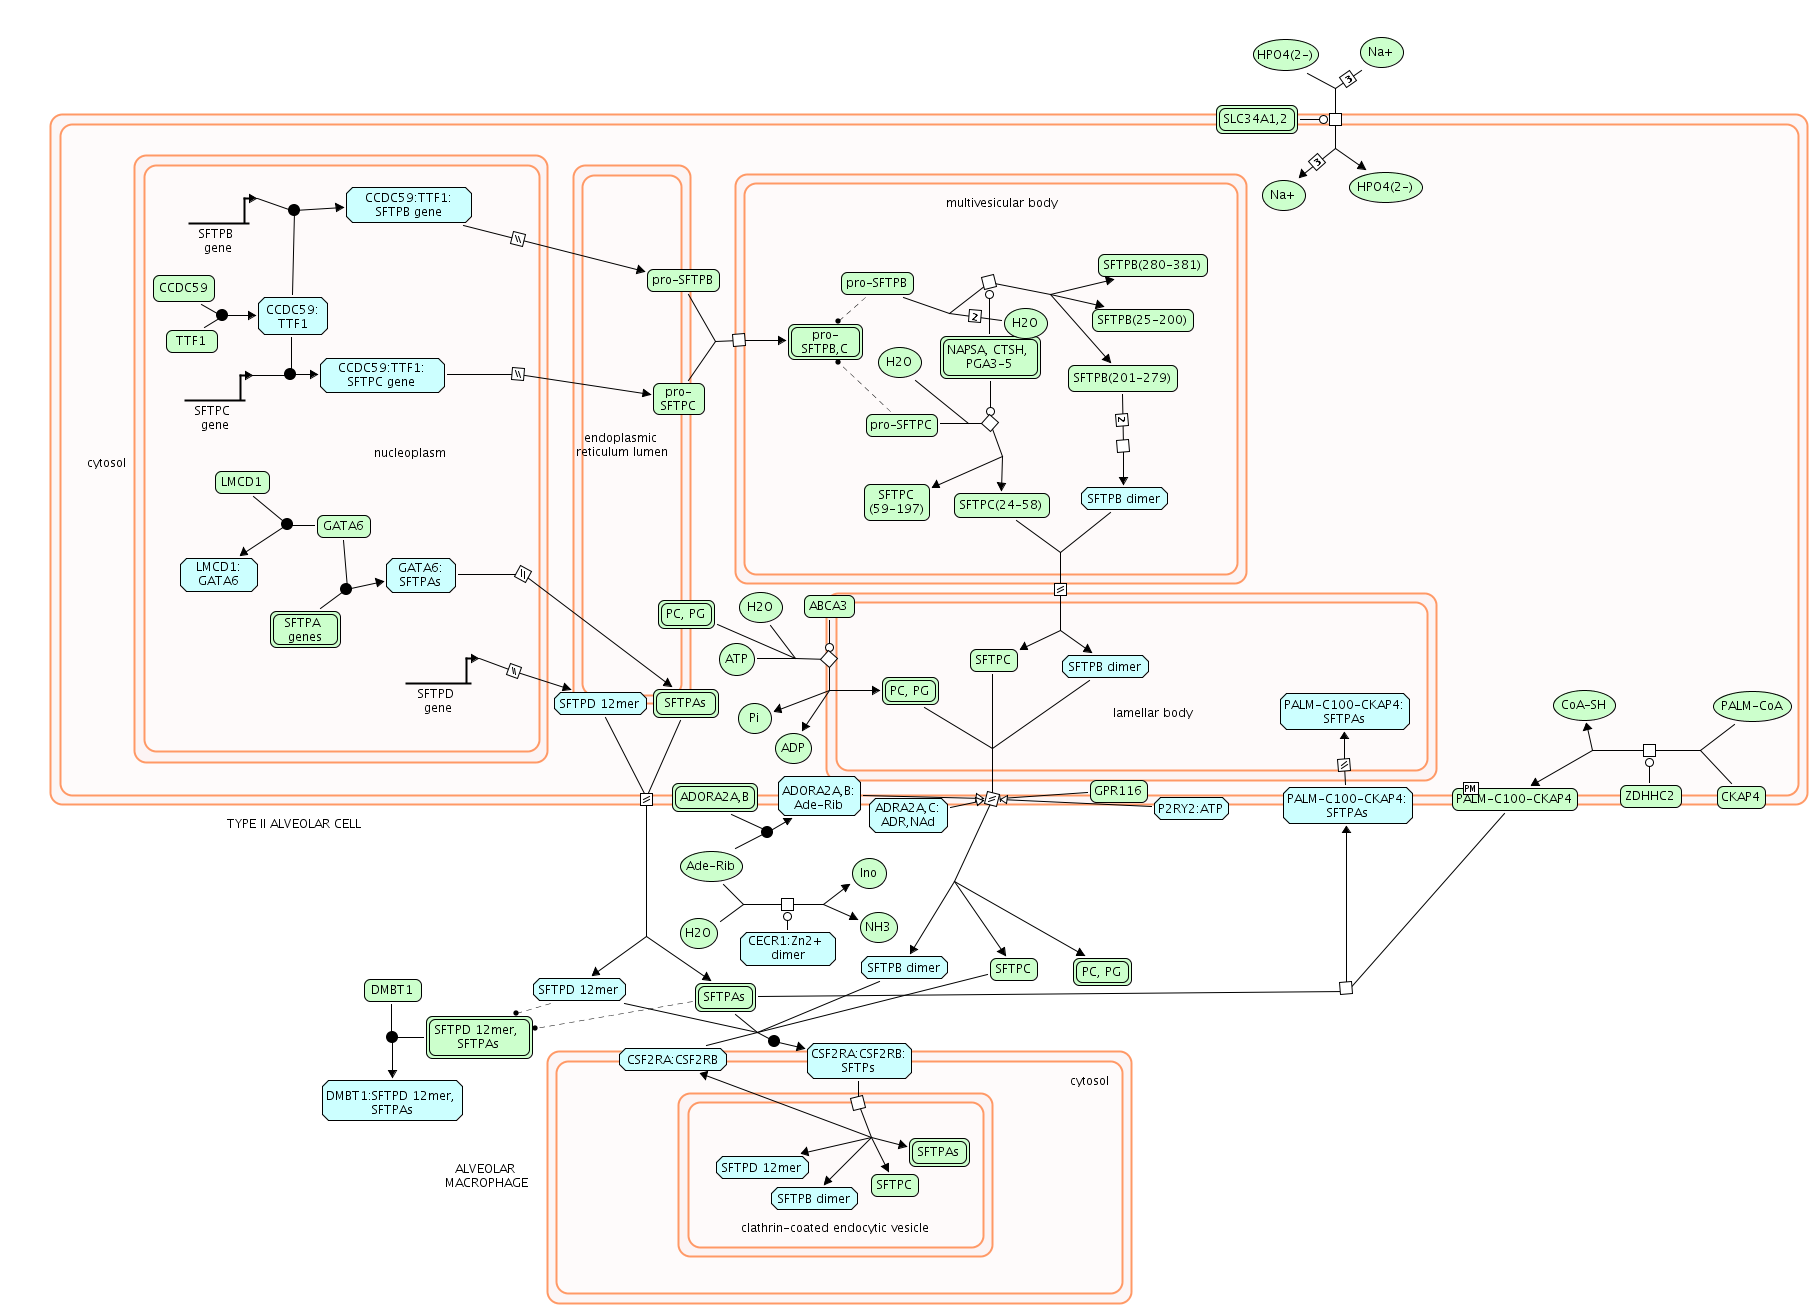
| Diagram of Surfactant metabolism.png | 2025-05-14 16:59 | 160K | |
| Diagram of Surfactant metabolism, Defective SLC34A2 causes pulmonary alveolar microlithiasis (PALM), Defective SFTPA2 causes idiopathic pulmonary fibrosis (IPF), Defective pro-SFTPB causes pulmonary surfactant metabolism dysfunction 1 (SMDP1) and resp.png | 2025-05-14 16:57 | 160K | |
| Diagram of Sulfur amino acid metabolism.png | 2025-05-14 17:00 | 238K | |
| Diagram of Striated Muscle Contraction.png | 2025-05-14 16:58 | 24K | |
| Diagram of Sphingolipid metabolism.png | 2025-05-14 16:56 | 408K | |
| Diagram of Smooth Muscle Contraction.png | 2025-05-14 17:00 | 70K | |
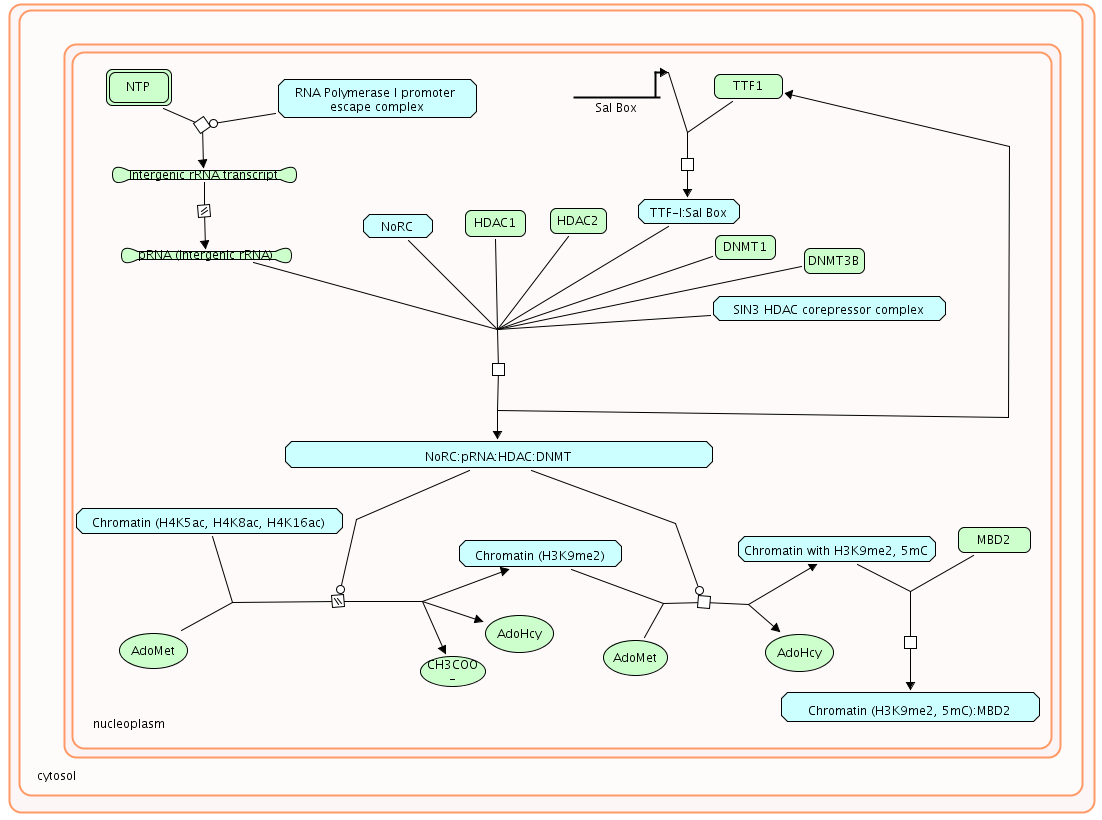
| Diagram of Silencing of rRNA Expression by Methylation of Histones and DNA.png | 2025-05-14 16:57 | 63K | |
| Diagram of Signal regulatory protein (SIRP) family interactions.png | 2025-05-14 17:00 | 37K | |
| Diagram of Signalling by NGF.png | 2025-05-14 16:56 | 384K | |
| Diagram of Signaling by the B Cell Receptor (BCR).png | 2025-05-14 16:58 | 294K | |
| Diagram of Signaling by moderate kinase activity BRAF mutants.png | 2025-05-14 16:57 | 513K | |
| Diagram of Signaling by high-kinase activity BRAF mutants.png | 2025-05-14 16:58 | 513K | |
| Diagram of Signaling by Wnt.png | 2025-05-14 16:59 | 8.5K | |
| Diagram of Signaling by WNT in cancer.png | 2025-05-14 16:58 | 18K | |
| Diagram of Signaling by VEGF.png | 2025-05-14 16:56 | 603K | |
| Diagram of Signaling by Type 1 Insulin-like Growth Factor 1 Receptor (IGF1R).png | 2025-05-14 16:57 | 116K | |
| Diagram of Signaling by TGF-beta Receptor Complex in Cancer.png | 2025-05-14 17:00 | 5.2K | |
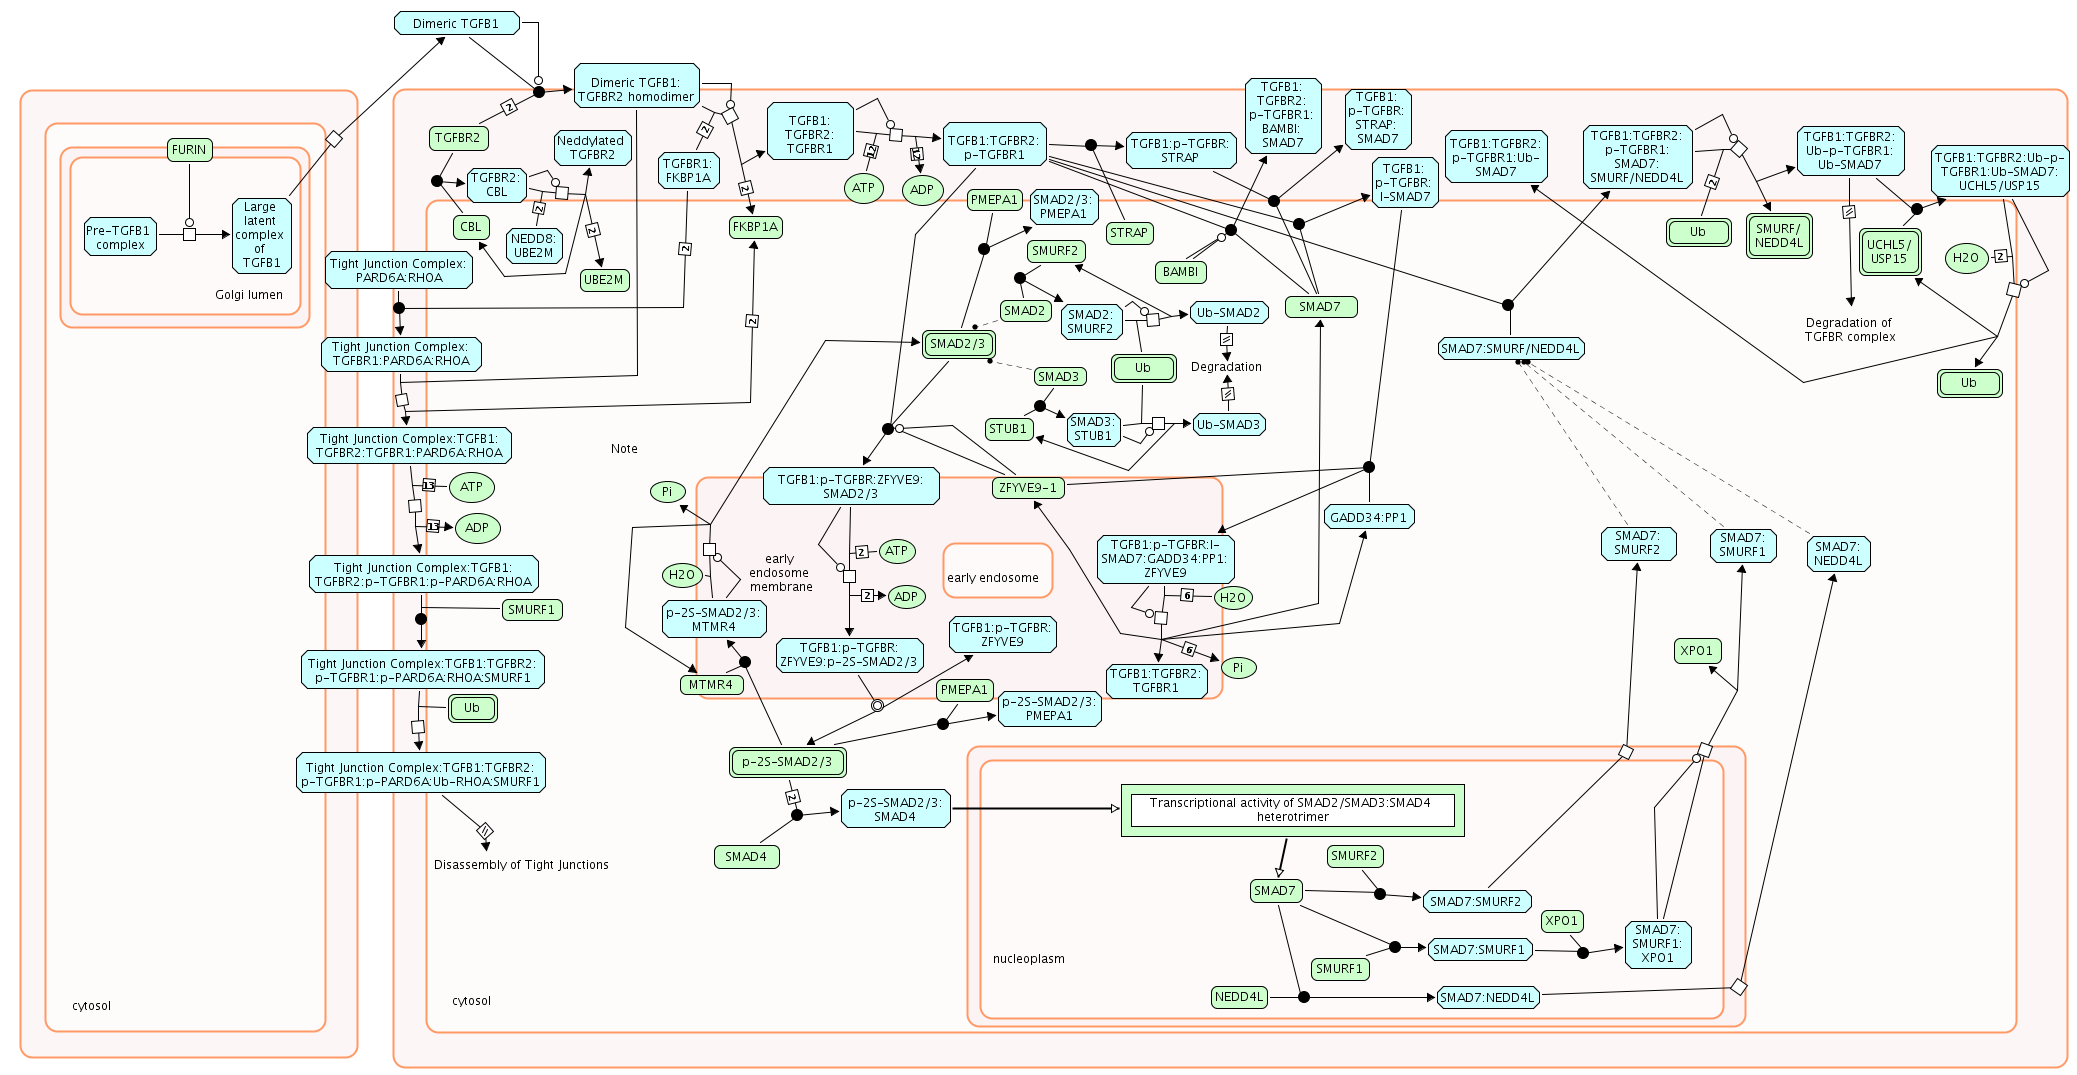
| Diagram of Signaling by TGF-beta Receptor Complex.png | 2025-05-14 16:55 | 242K | |
| Diagram of Signaling by TGF-beta Receptor Complex, SMAD4 MH2 Domain Mutants in Cancer, SMAD2-3 Phosphorylation Motif Mutants in Cancer, SMAD2-3 MH2 Domain Mutants in Cancer, TGFBR2 MSI Frameshift Mutants in Cancer, TGFBR2 Kinase Domain Mutants in Canc.png | 2025-05-14 16:58 | 242K | |
| Diagram of Signaling by Robo receptor.png | 2025-05-14 16:57 | 62K | |
| Diagram of Signaling by Rho GTPases.png | 2025-05-14 16:56 | 23K | |
| Diagram of Signaling by Retinoic Acid.png | 2025-05-14 16:59 | 173K | |
| Diagram of Signaling by RAS mutants.png | 2025-05-14 16:57 | 513K | |
| Diagram of Signaling by PTK6.png | 2025-05-14 16:57 | 393K | |
| Diagram of Signaling by PDGF.png | 2025-05-14 16:56 | 157K | |
| Diagram of Signaling by Overexpressed Wild-Type EGFR in Cancer.png | 2025-05-14 17:00 | 459K | |
| Diagram of Signaling by NOTCH4.png | 2025-05-14 16:59 | 25K | |
| Diagram of Signaling by NOTCH3.png | 2025-05-14 16:58 | 26K | |
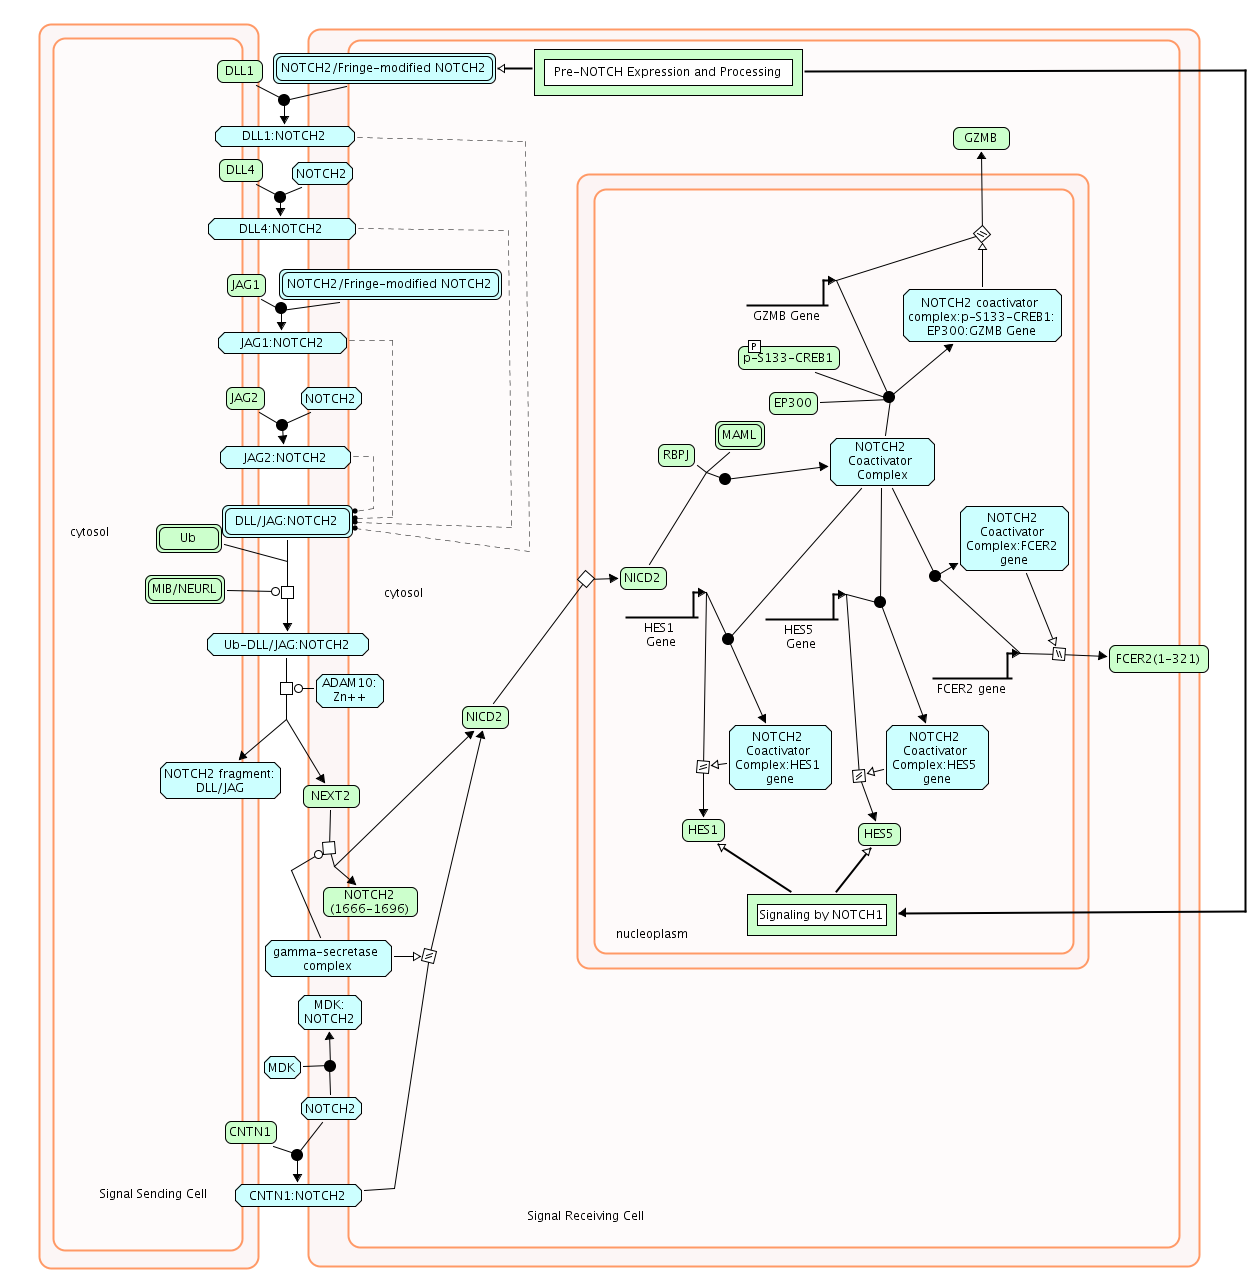
| Diagram of Signaling by NOTCH2.png | 2025-05-14 16:56 | 110K | |
| Diagram of Signaling by NOTCH1 t(7;9)(NOTCH1_M1580_K2555) Translocation Mutant.png | 2025-05-14 16:55 | 209K | |
| Diagram of Signaling by NOTCH1 in Cancer.png | 2025-05-14 17:00 | 9.7K | |
| Diagram of Signaling by NOTCH1 PEST Domain Mutants in Cancer.png | 2025-05-14 16:58 | 209K | |
| Diagram of Signaling by NOTCH1 HD Domain Mutants in Cancer.png | 2025-05-14 17:00 | 209K | |
| Diagram of Signaling by NOTCH1.png | 2025-05-14 16:57 | 209K | |
| Diagram of Signaling by NOTCH1, Signaling by NOTCH1 PEST Domain Mutants in Cancer, Signaling by NOTCH1 t(7;9)(NOTCH1_M1580_K2555) Translocation Mutant, Signaling by NOTCH1 HD Domain Mutants in Cancer, FBXW7 Mutants and NOTCH1 in Cancer, and Signaling.png | 2025-05-14 16:58 | 209K | |
| Diagram of Signaling by NOTCH.png | 2025-05-14 16:57 | 10K | |
| Diagram of Signaling by NODAL.png | 2025-05-14 17:00 | 76K | |
| Diagram of Signaling by MST1.png | 2025-05-14 16:58 | 21K | |
| Diagram of Signaling by Lig-Responsive EGFR Variants in Cancer.png | 2025-05-14 16:56 | 459K | |
| Diagram of Signaling by Leptin.png | 2025-05-14 16:56 | 110K | |
| Diagram of Signaling by Interleukins and related cytokines.png | 2025-05-14 16:57 | 101K | |
| Diagram of Signaling by Insulin receptor.png | 2025-05-14 16:59 | 183K | |
| Diagram of Signaling by Hippo.png | 2025-05-14 16:59 | 125K | |
| Diagram of Signaling by GPCR.png | 2025-05-14 16:55 | 11K | |
| Diagram of Signaling by FGFR in disease.png | 2025-05-14 16:58 | 2.9K | |
| Diagram of Signaling by FGFR4 and Signaling by FGFR4 in disease.png | 2025-05-14 17:00 | 459K | |
| Diagram of Signaling by FGFR3 and Signaling by FGFR3 in disease.png | 2025-05-14 16:58 | 492K | |
| Diagram of Signaling by FGFR2 and Signaling by FGFR2 in disease.png | 2025-05-14 17:00 | 586K | |
| Diagram of Signaling by FGFR1 and Signaling by FGFR1 in disease.png | 2025-05-14 16:55 | 727K | |
| Diagram of Signaling by FGFR.png | 2025-05-14 16:59 | 2.5K | |
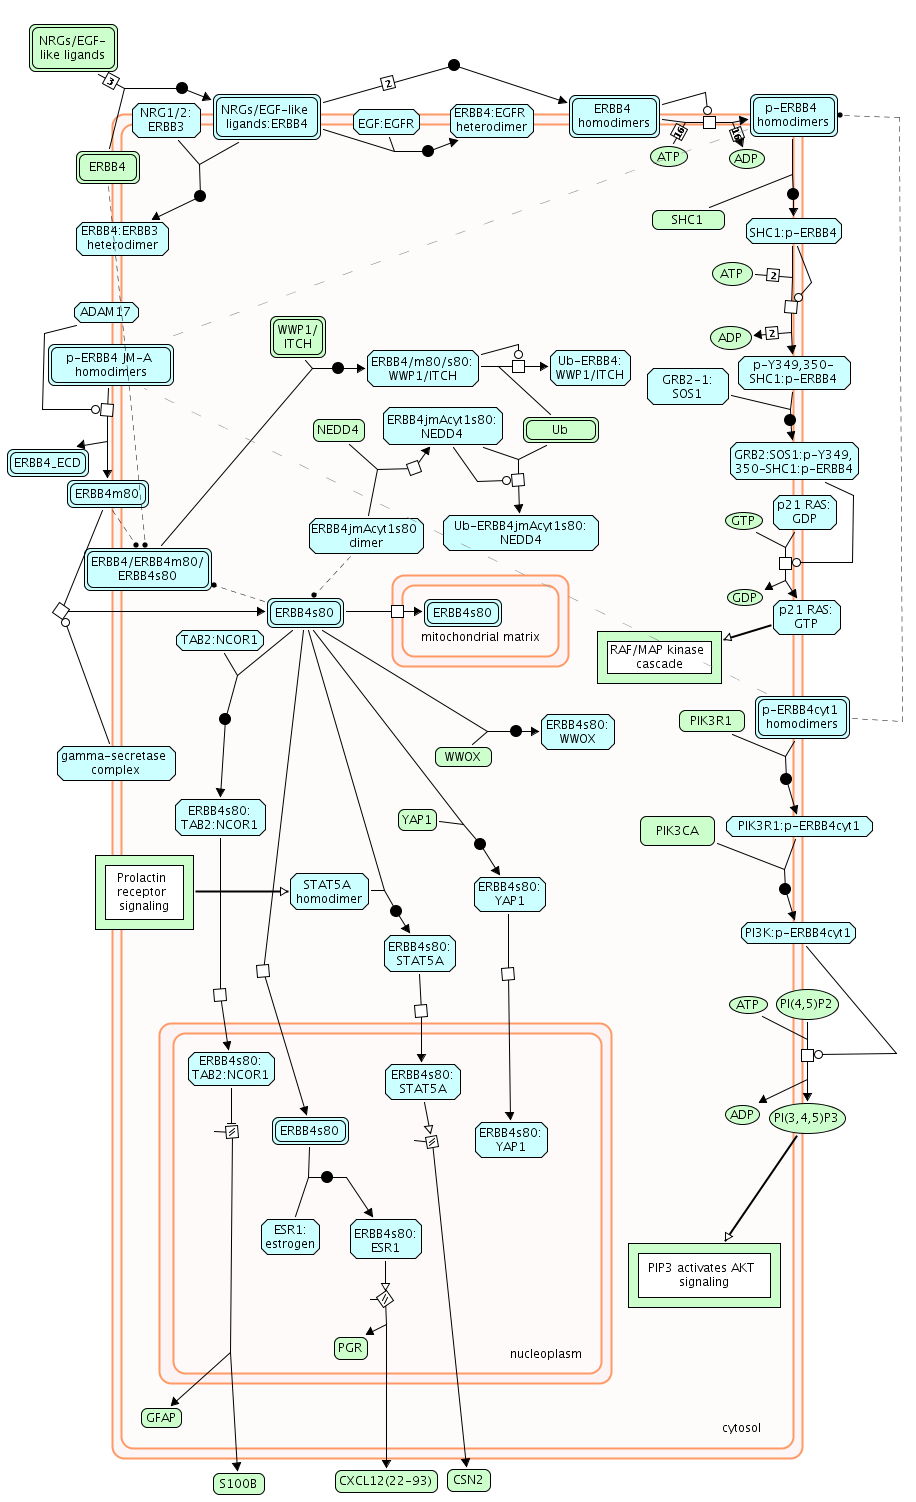
| Diagram of Signaling by ERBB4.png | 2025-05-14 16:59 | 145K | |
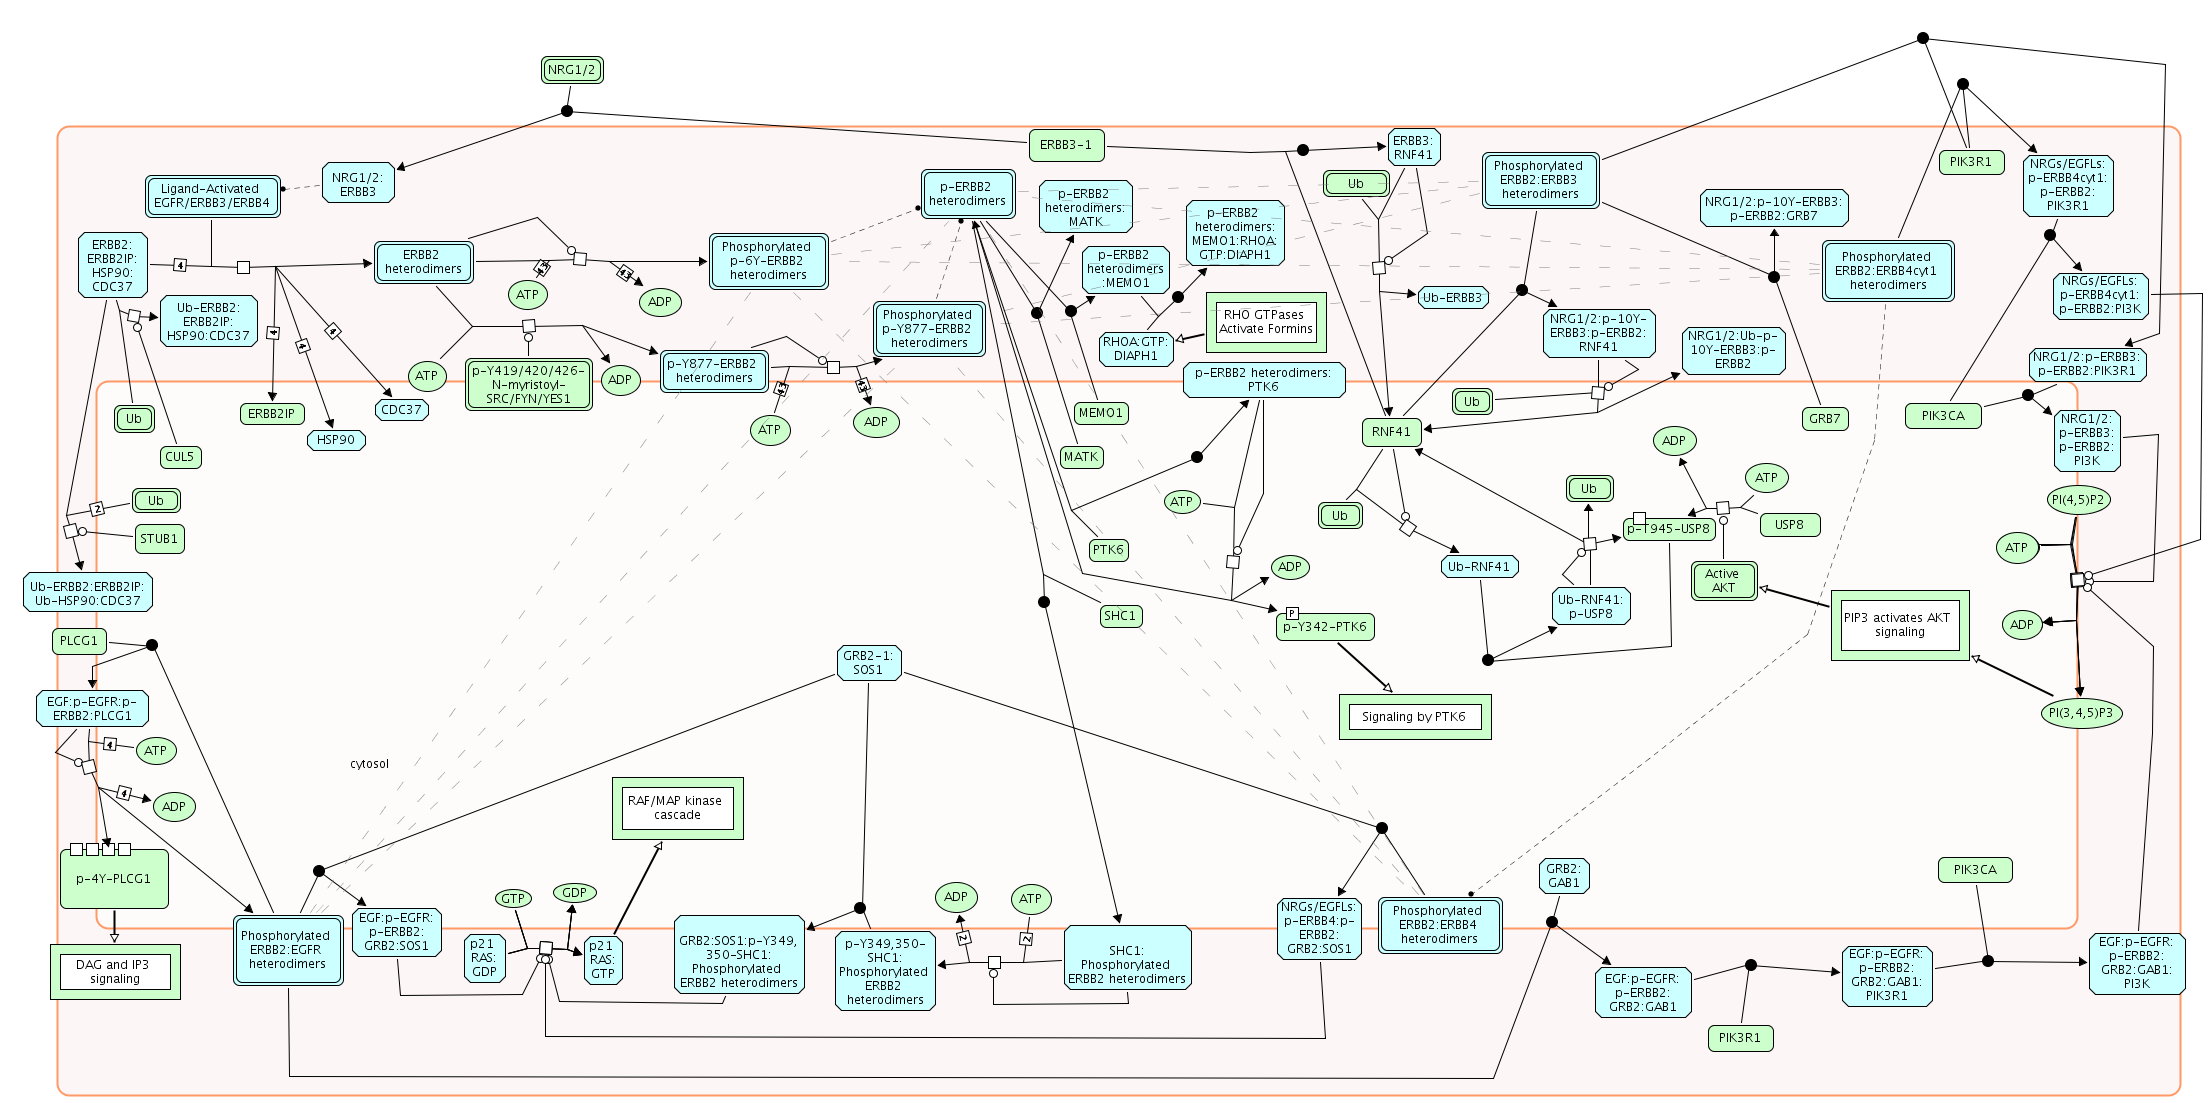
| Diagram of Signaling by ERBB2.png | 2025-05-14 16:57 | 283K | |
| Diagram of Signaling by EGFRvIII in Cancer.png | 2025-05-14 17:00 | 459K | |
| Diagram of Signaling by EGFR in Cancer.png | 2025-05-14 16:59 | 6.3K | |
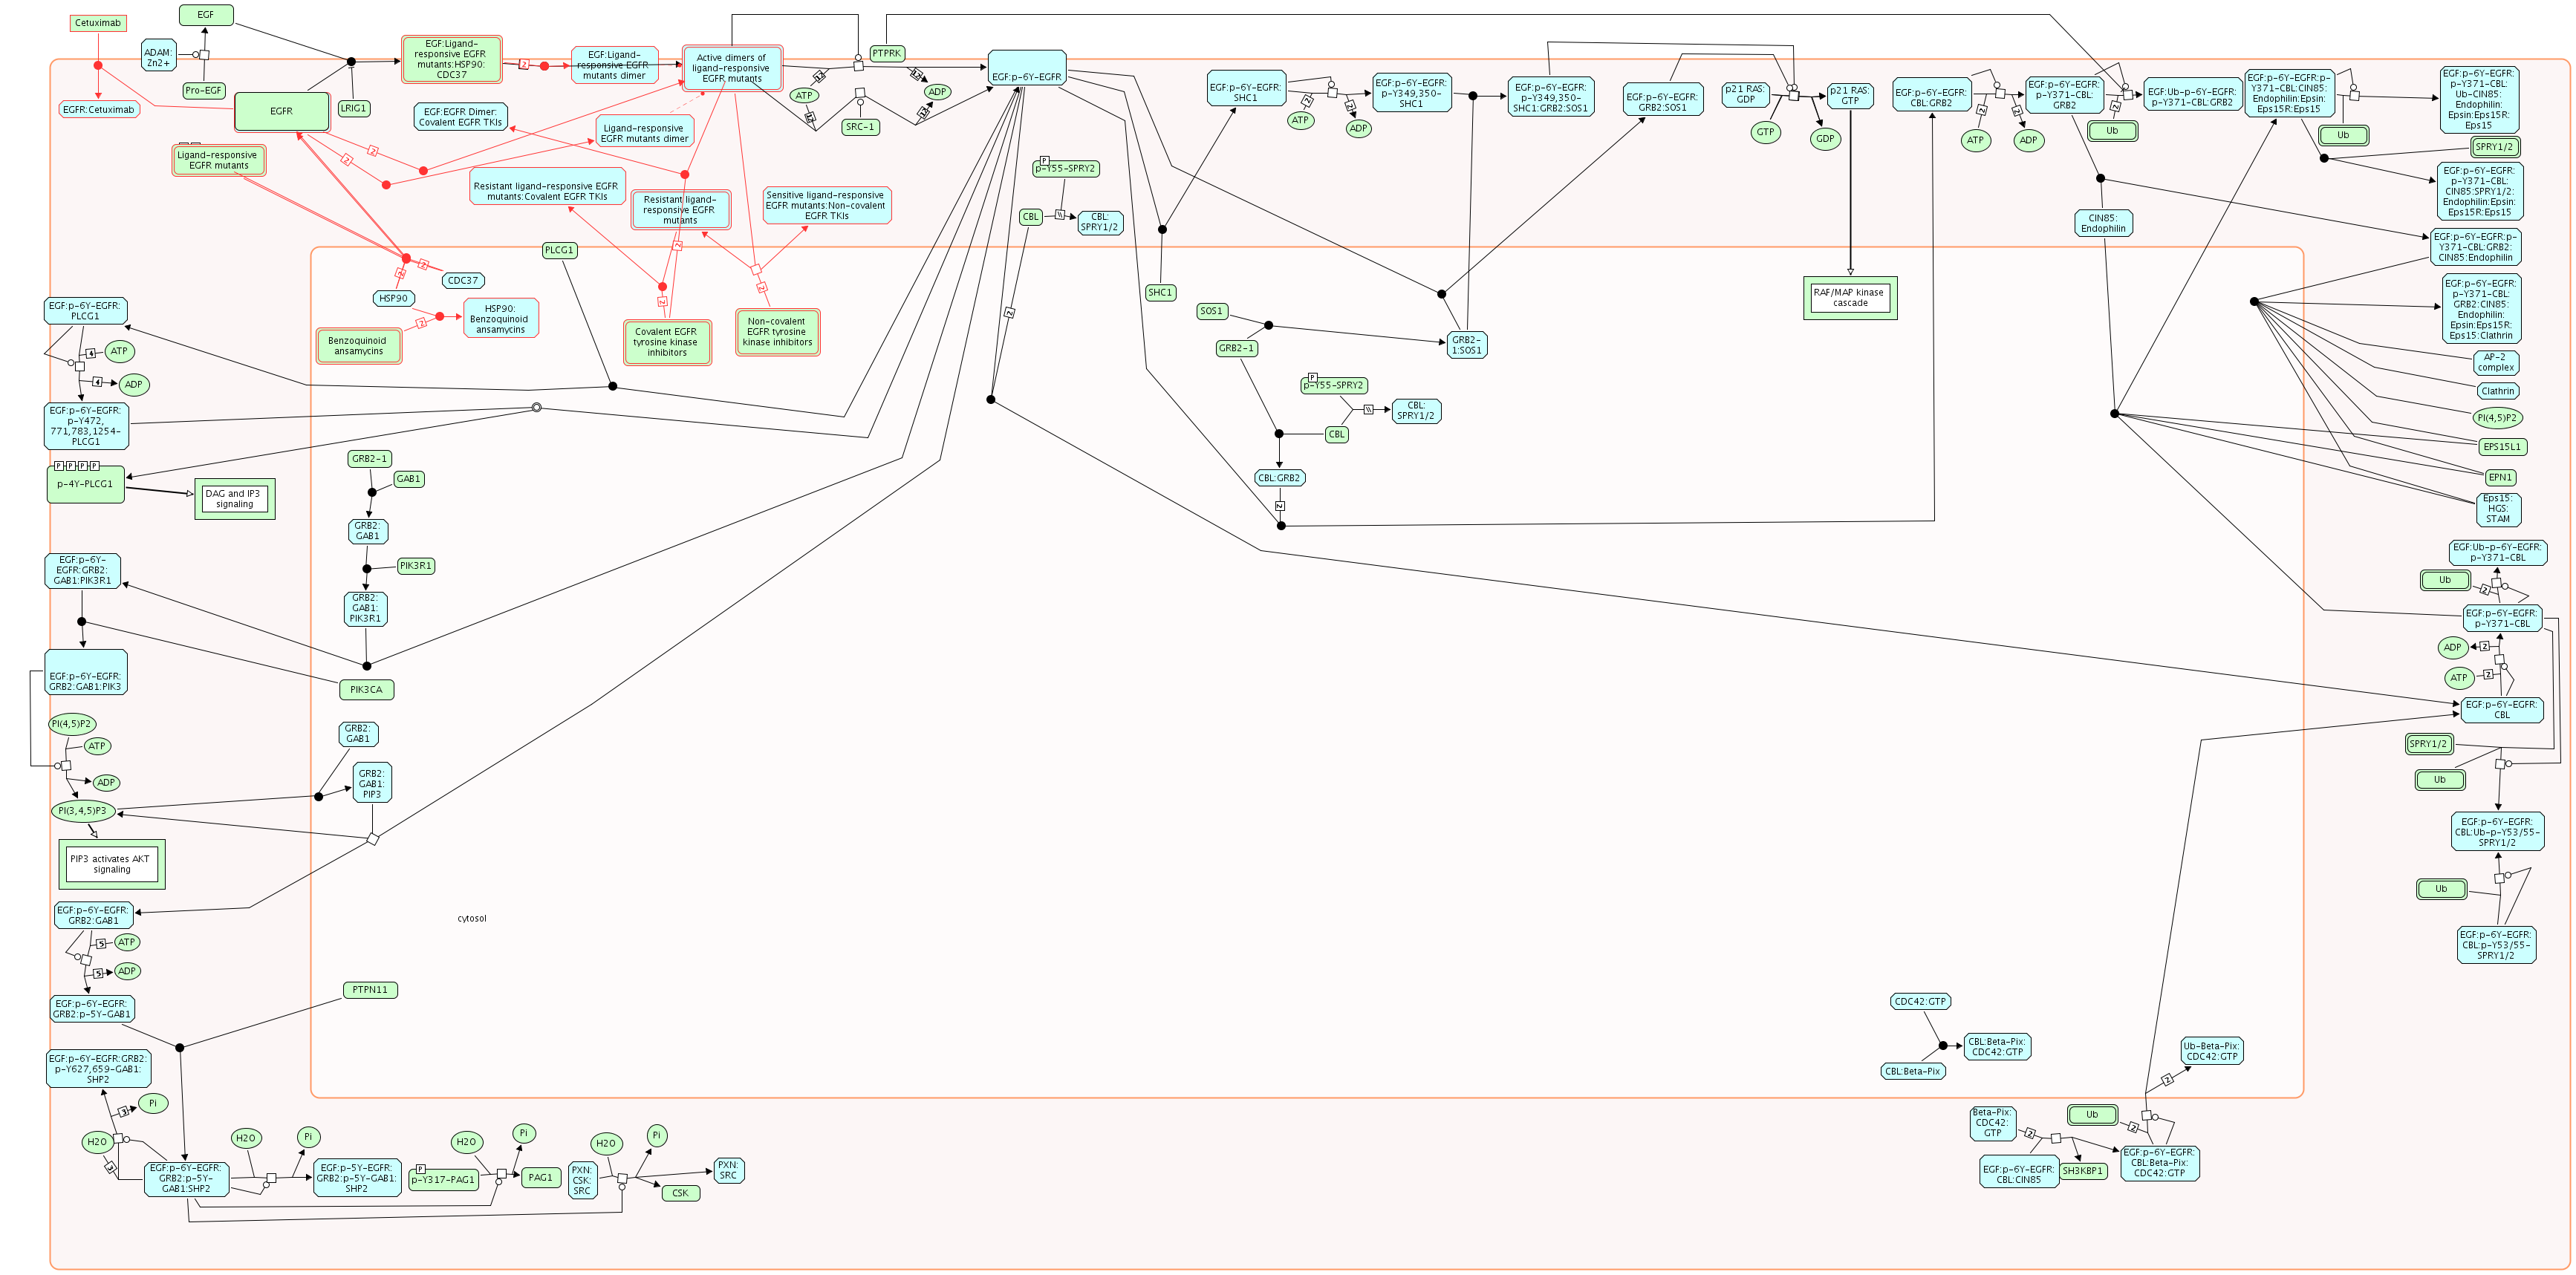
| Diagram of Signaling by EGFR.png | 2025-05-14 16:56 | 459K | |
| Diagram of Signaling by EGFR, Signaling by EGFRvIII in Cancer, Signaling by Ligand-Responsive EGFR Variants in Cancer, and Signaling by Overexpressed Wild-Type EGFR in Cancer.png | 2025-05-14 16:57 | 459K | |
| Diagram of Signaling by BRAF RAF.png | 2025-05-14 17:01 | 513K | |
| Diagram of Signaling by BMP.png | 2025-05-14 17:00 | 66K | |
| Diagram of Signaling by Activin.png | 2025-05-14 17:00 | 75K | |
| Diagram of Signaling.png | 2025-05-14 16:59 | 209K | |
| Diagram of Signal amplification.png | 2025-05-14 17:00 | 143K | |
| Diagram of Signal Transduction.png | 2025-05-14 16:58 | 28K | |
| Diagram of Sialic acid metabolism.png | 2025-05-14 16:58 | 142K | |
| Diagram of Sialic acid metabolism, Defective SLC17A5 causes Salla disease (SD) and ISSD, Defective NEU1 causes sialidosis, Defective GNE causes sialuria, Nonaka myopathy and inclusion body myopathy 2, and Defective SLC35A1 causes congenital disorder .png | 2025-05-14 16:58 | 142K | |
| Diagram of Severe congenital neutropenia type 4 (G6PC3).png | 2025-05-14 16:59 | 91K | |
| Diagram of Senescence-Associated Secretory Phenotype (SASP).png | 2025-05-14 16:56 | 158K | |
| Diagram of Semaphorin interactions.png | 2025-05-14 16:56 | 254K | |
| Diagram of Selenoamino acid metabolism.png | 2025-05-14 16:56 | 266K | |
| Diagram of SUMOylation of transcription factors.png | 2025-05-14 17:00 | 68K | |
| Diagram of SUMOylation of chromatin organization proteins.png | 2025-05-14 16:57 | 17K | |
| Diagram of SUMOylation of RNA binding proteins.png | 2025-05-14 16:58 | 27K | |
| Diagram of SUMOylation of DNA replication proteins.png | 2025-05-14 16:59 | 54K | |
| Diagram of SUMOylation of DNA damage response and repair proteins.png | 2025-05-14 16:56 | 146K | |
| Diagram of SUMOylation.png | 2025-05-14 16:57 | 56K | |
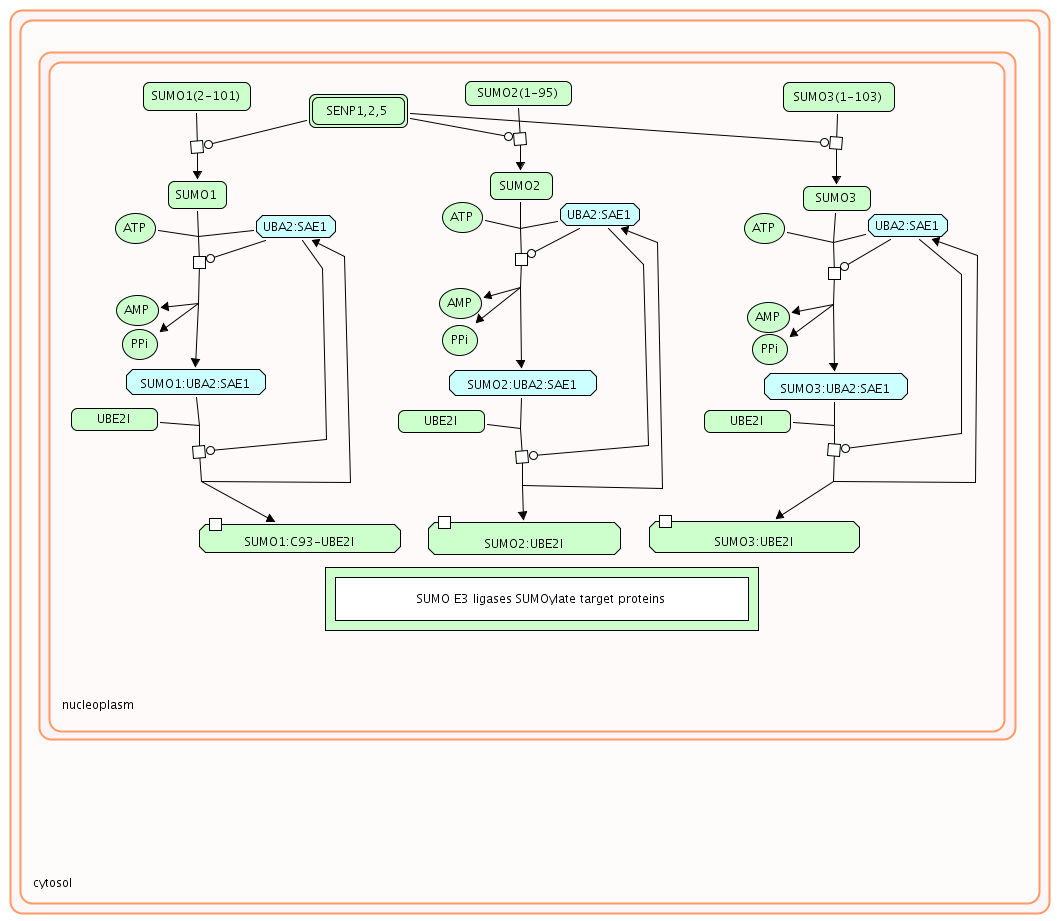
| Diagram of SUMO E3 ligases SUMOylate target proteins.png | 2025-05-14 17:00 | 18K | |
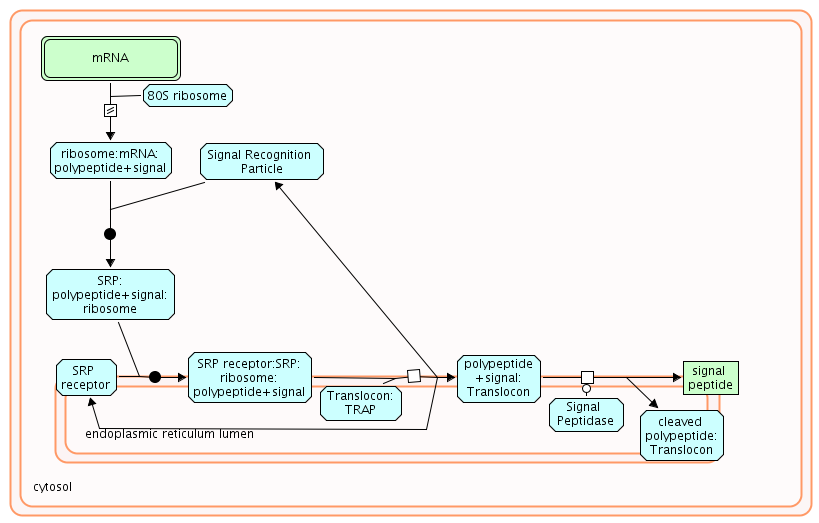
| Diagram of SRP-dependent cotranslational protein targeting to membrane.png | 2025-05-14 16:58 | 28K | |
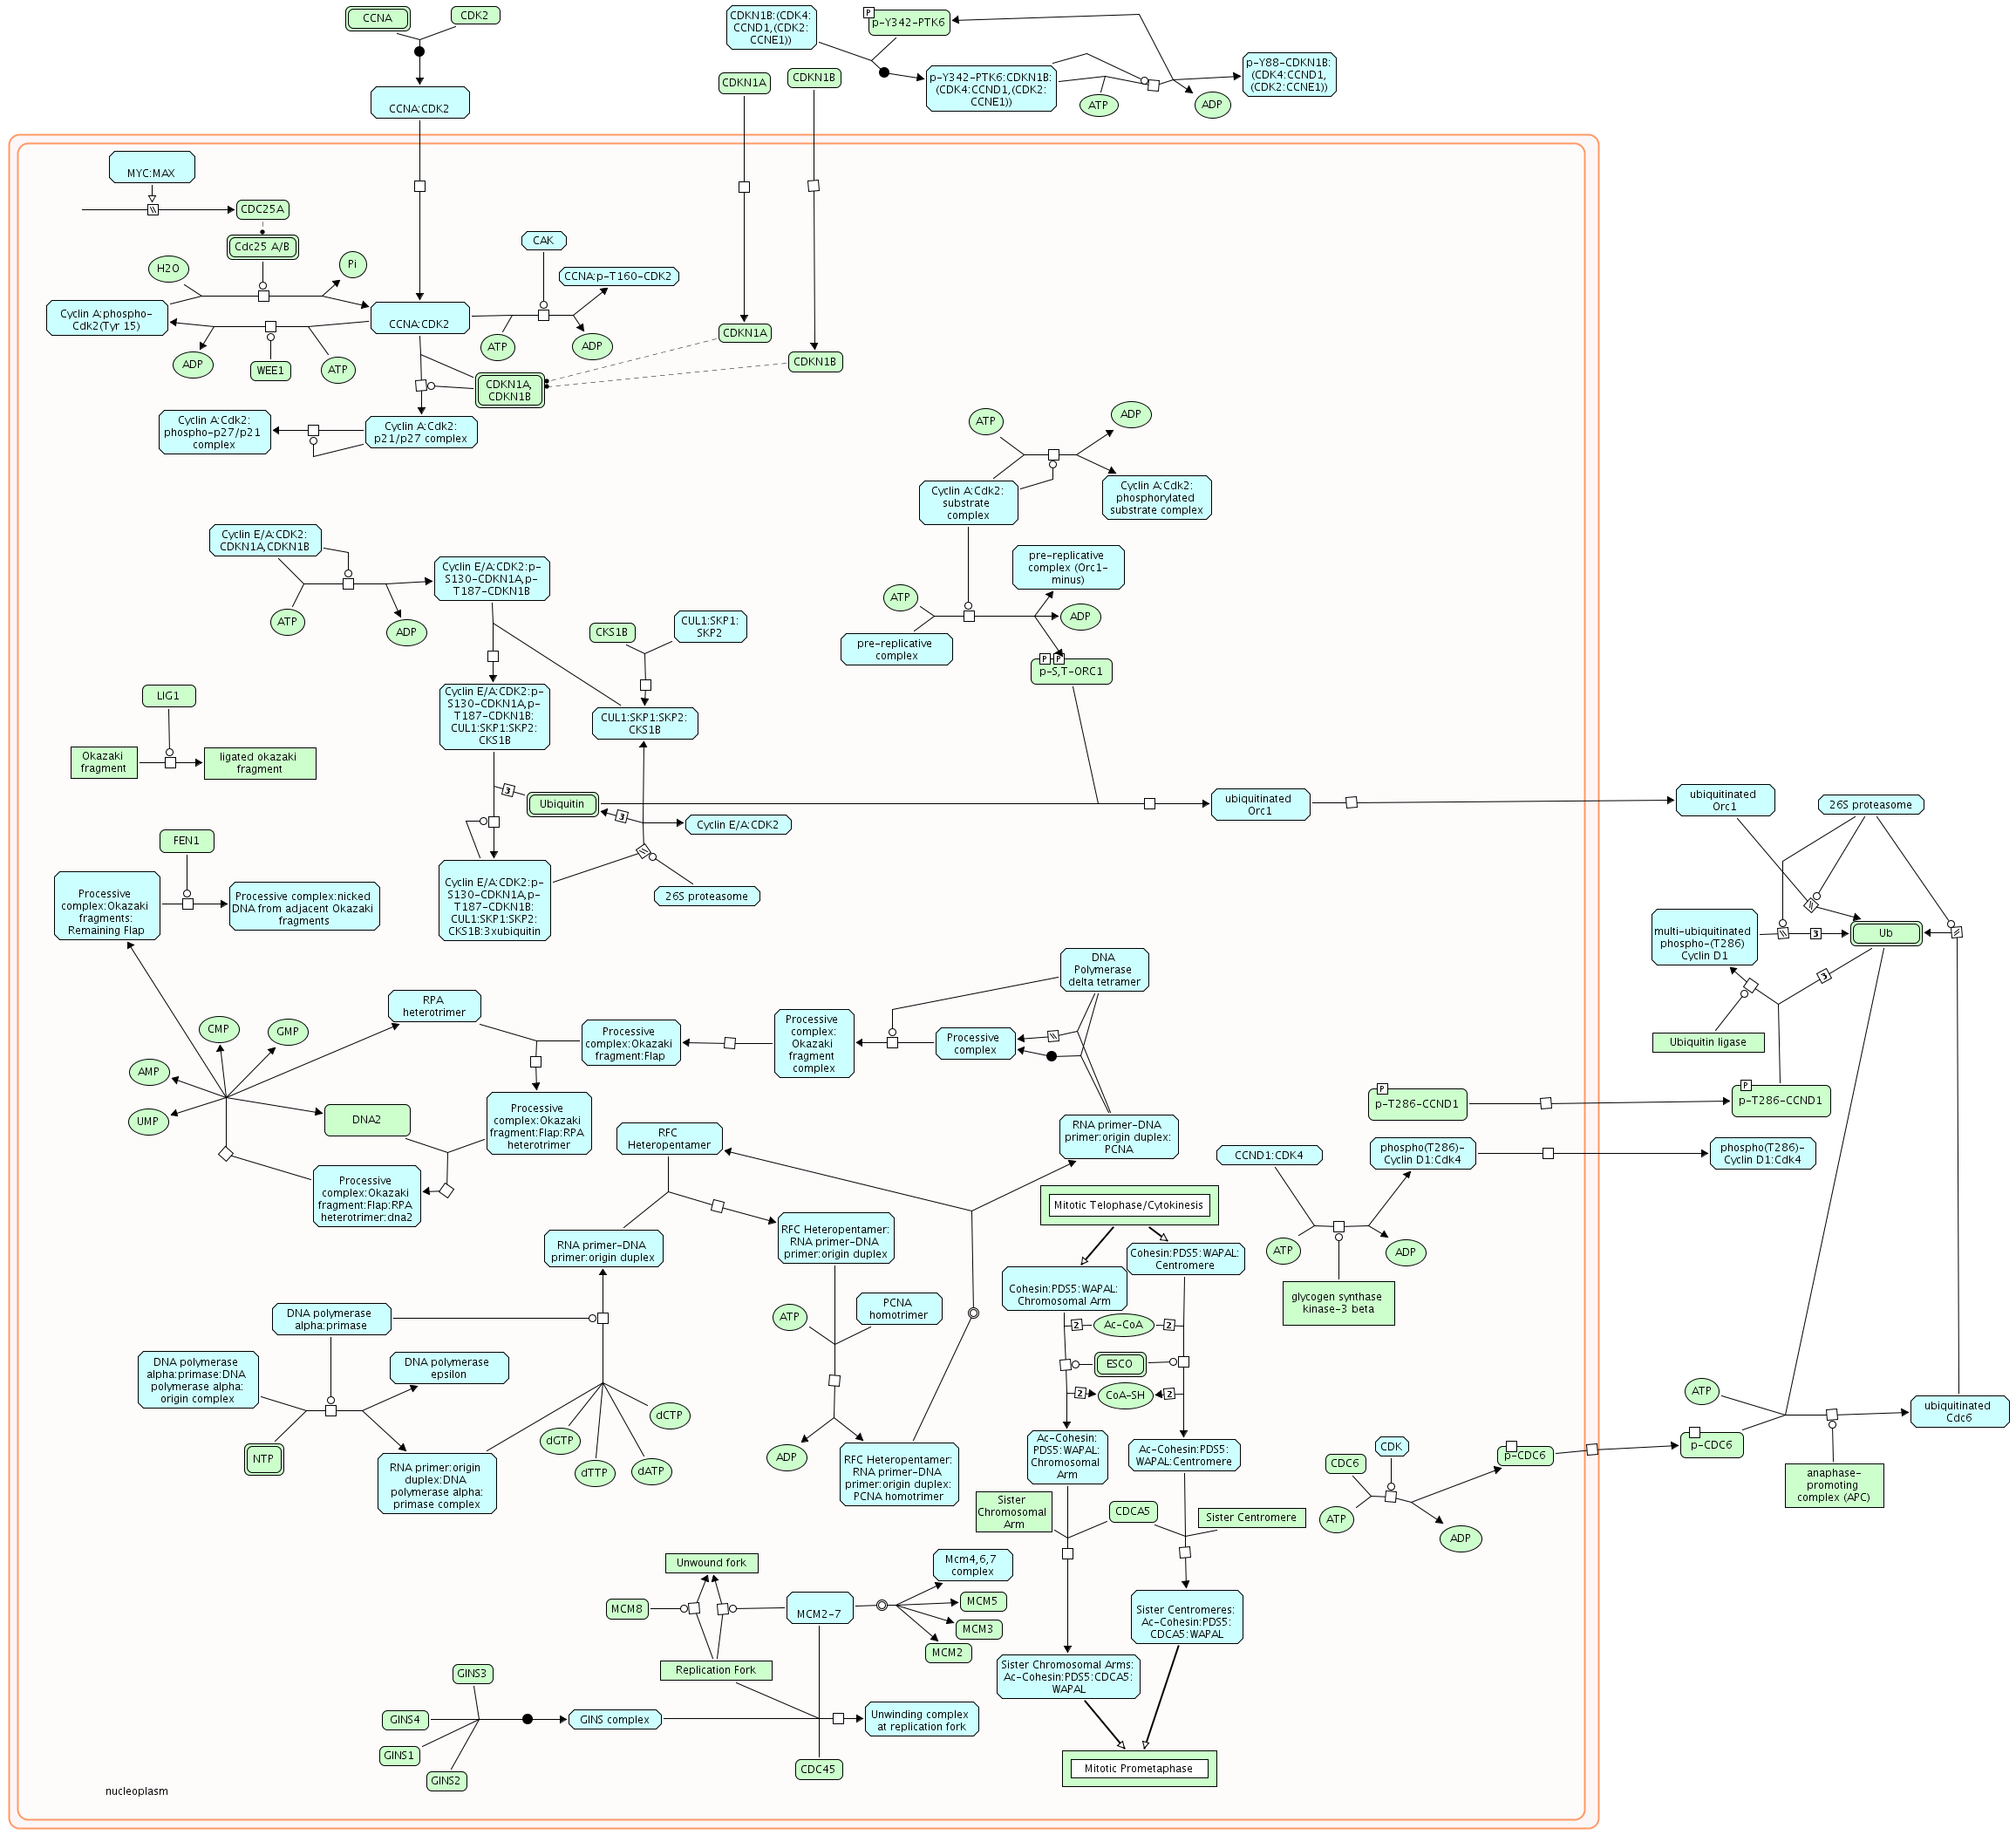
| Diagram of S Phase.png | 2025-05-14 16:57 | 320K | |
| Diagram of SMAD4 MH2 Domain Mutants in Cancer.png | 2025-05-14 16:57 | 242K | |
| Diagram of SMAD2-3 Phosphorylation Motif Mutants in Cancer.png | 2025-05-14 16:55 | 242K | |
| Diagram of SMAD2-3 MH2 Domain Mutants in Cancer.png | 2025-05-14 16:59 | 242K | |
| Diagram of SLC transporter disorders.png | 2025-05-14 16:59 | 122K | |
| Diagram of SLC-mediated transmembrane transport.png | 2025-05-14 16:58 | 9.2K | |
| Diagram of SCF-KIT signaling.png | 2025-05-14 16:58 | 209K | |
| Diagram of SALM protein interactions at the synapse.png | 2025-05-14 16:56 | 48K | |
| Diagram of S45 mutants of beta-catenin aren't phosphorylated.png | 2025-05-14 16:58 | 148K | |
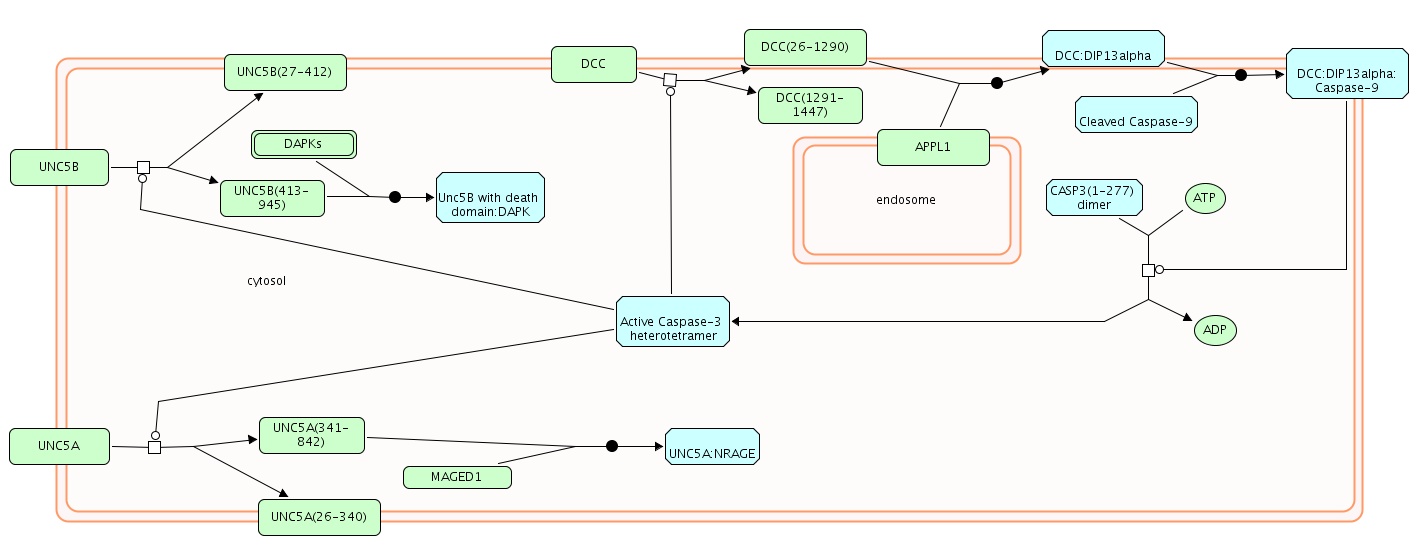
| Diagram of Role of DCC in regulating apoptosis.png | 2025-05-14 16:56 | 52K | |
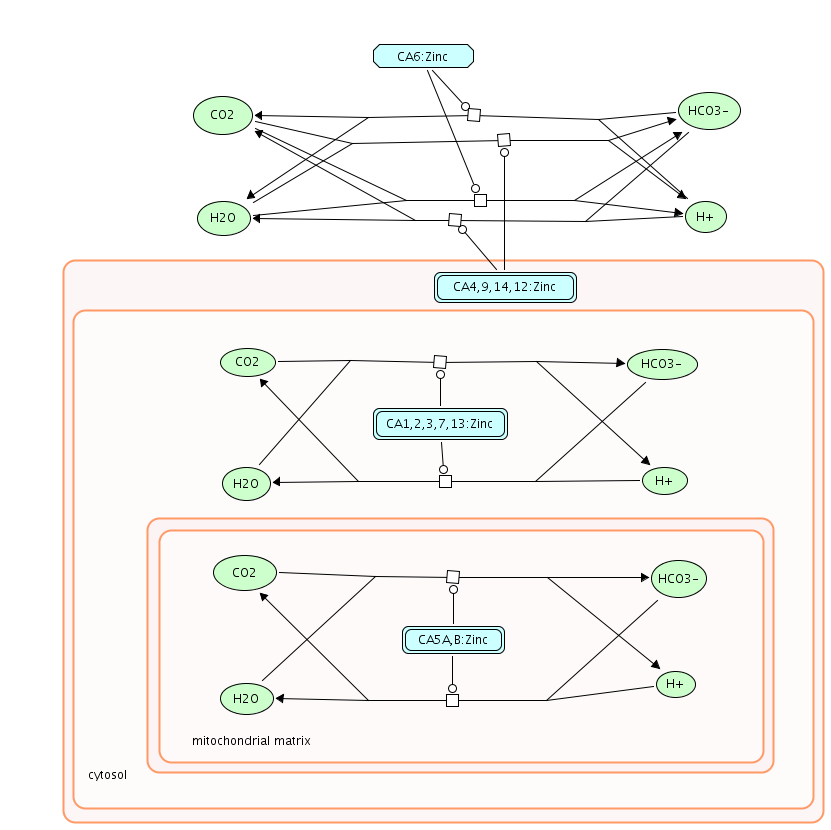
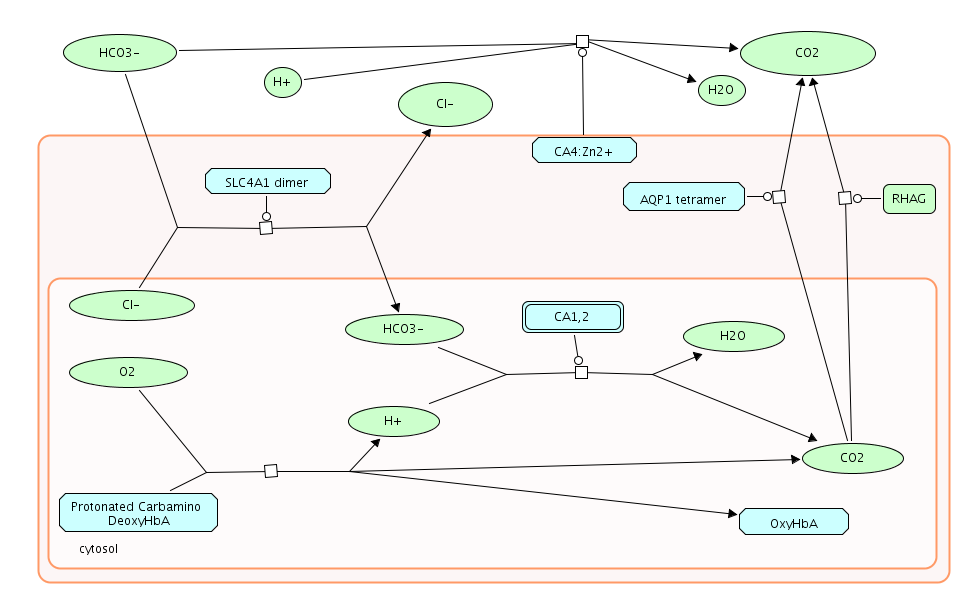
| Diagram of Reversible hydration of carbon dioxide.png | 2025-05-14 16:58 | 58K | |
| Diagram of Retinoid metabolism and transport and Retinoid metabolism disease events.png | 2025-05-14 16:57 | 135K | |
| Diagram of Retinoid cycle disease events.png | 2025-05-14 16:55 | 375K | |
| Diagram of Response to metal ions.png | 2025-05-14 16:55 | 6.8K | |
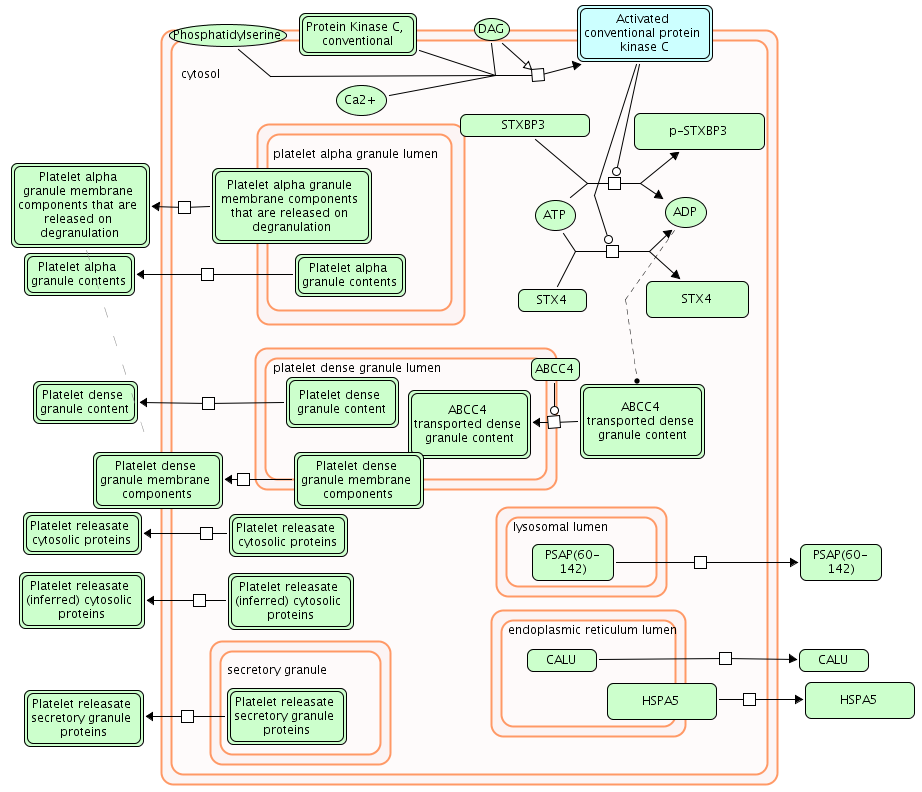
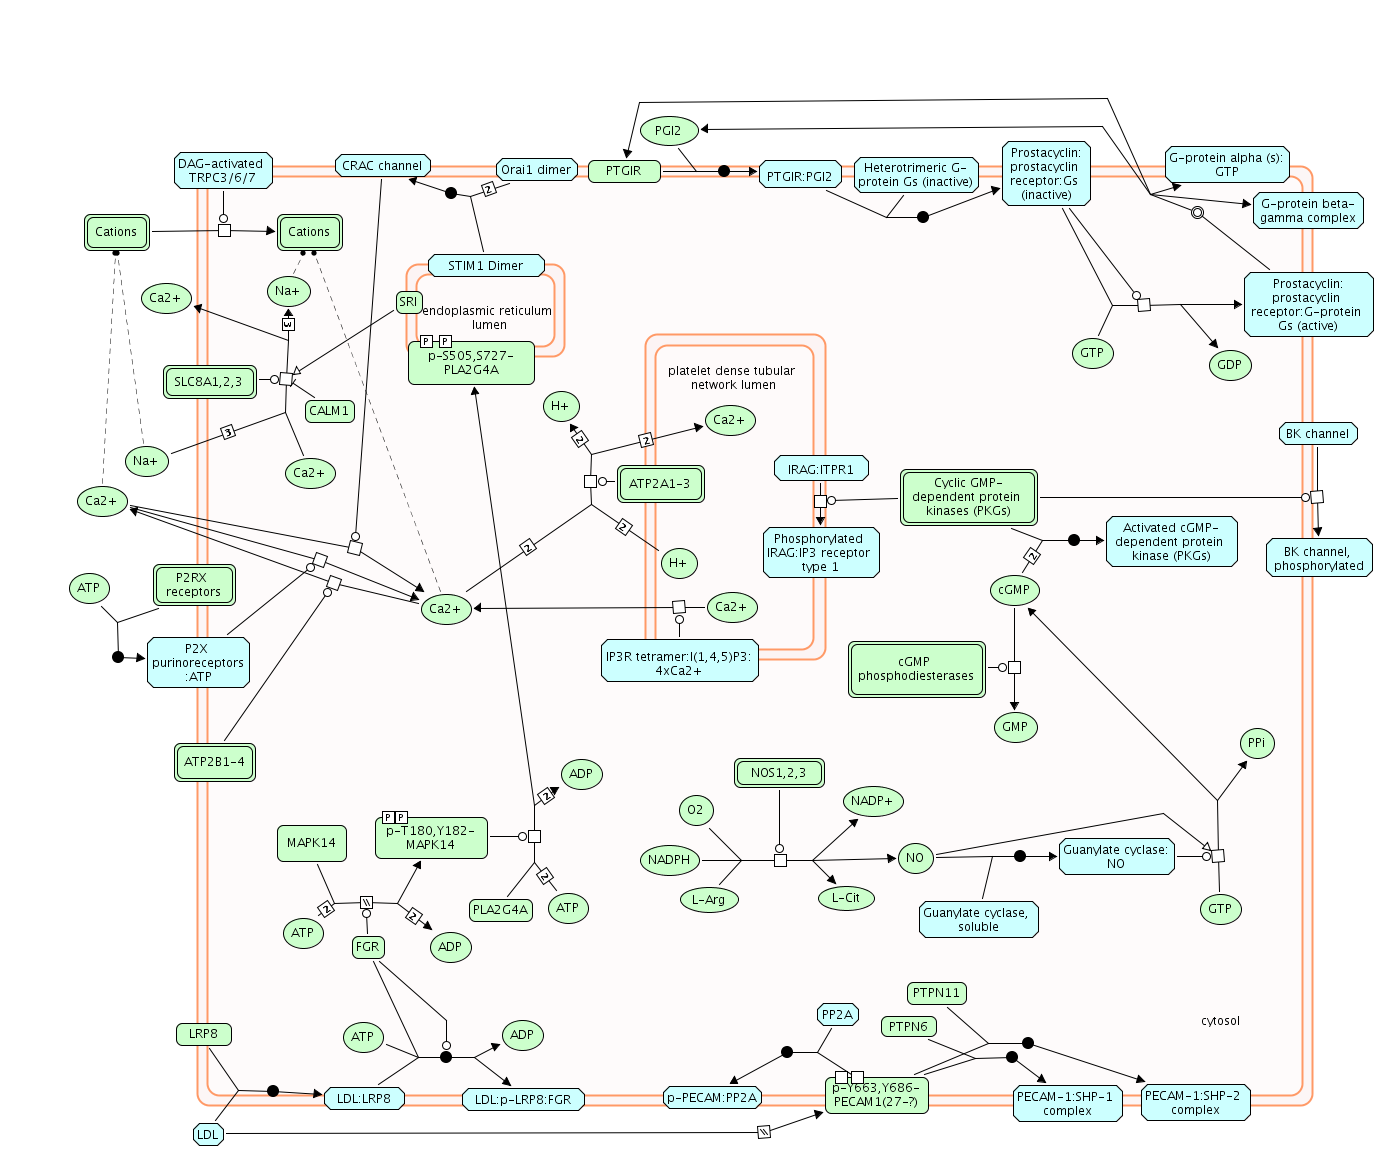
| Diagram of Response to elevated platelet cytosolic Ca2+.png | 2025-05-14 16:55 | 67K | |
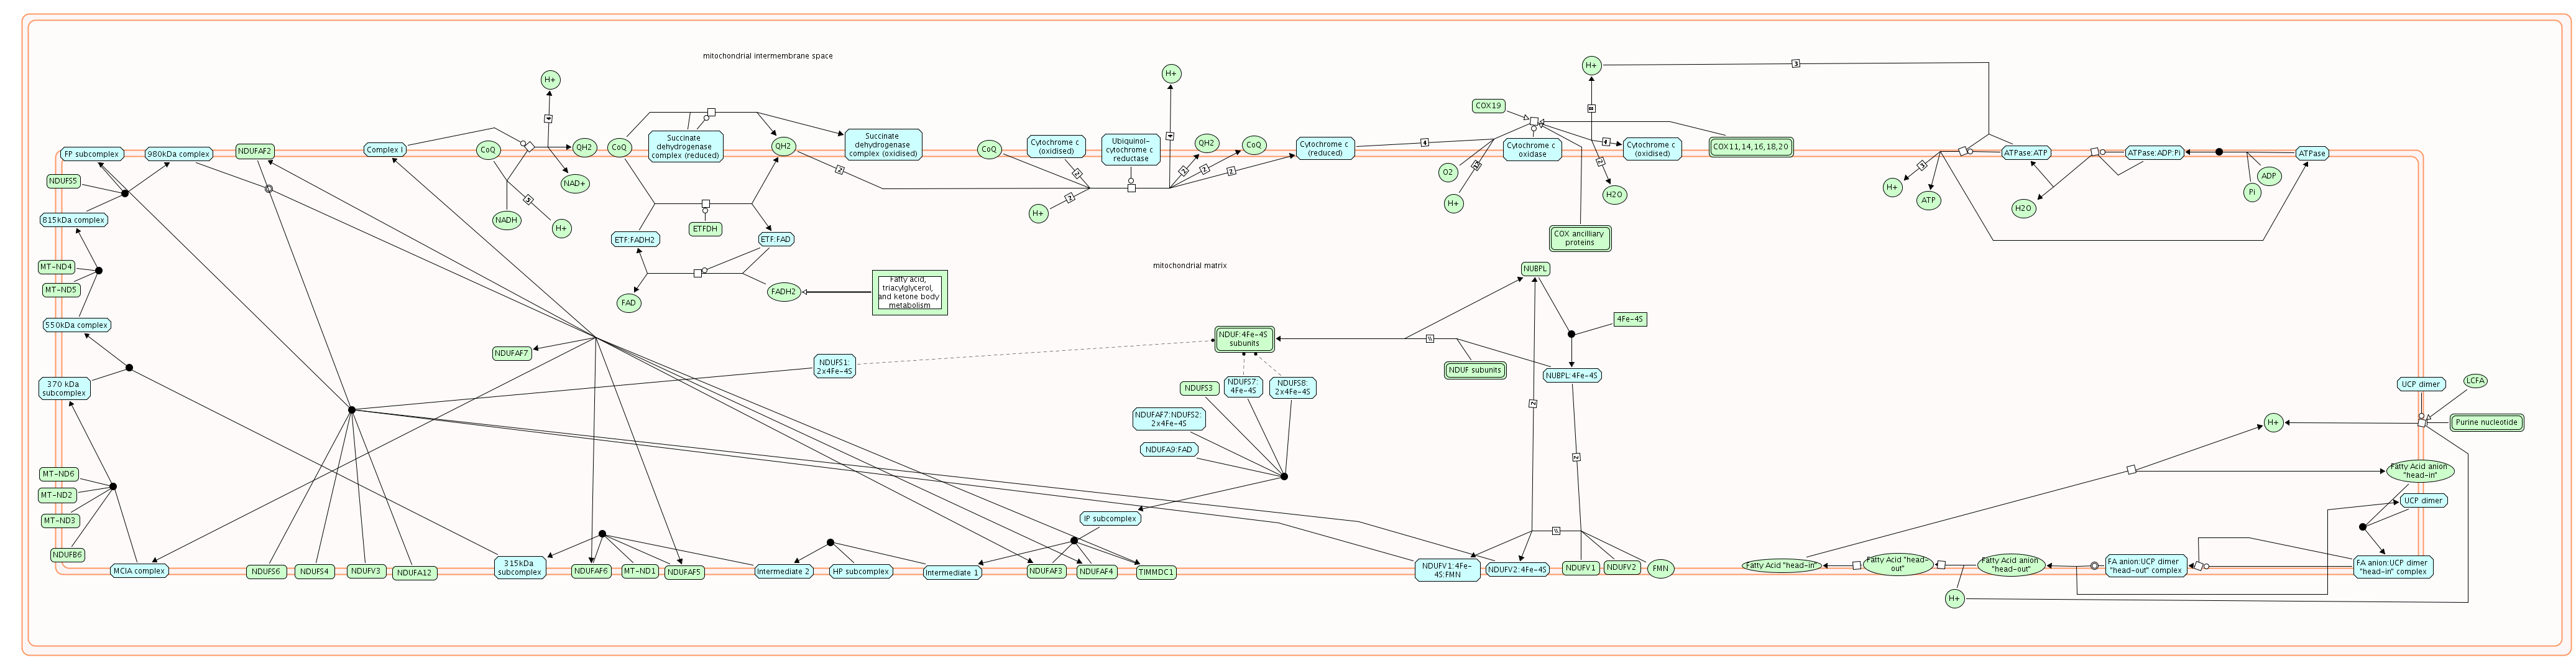
| Diagram of Respiratory electron transport.png | 2025-05-14 17:00 | 305K | |
| Diagram of Respiratory electron transport, ATP synthesis by chemiosmotic coupling, and heat production by uncoupling proteins..png | 2025-05-14 16:58 | 305K | |
| Diagram of Resolution of Abasic Sites (AP sites).png | 2025-05-14 17:00 | 260K | |
| Diagram of Reproduction.png | 2025-05-14 16:58 | 6.6K | |
| Diagram of Regulation of rRNA Expression by SIRT1.png | 2025-05-14 17:00 | 48K | |
| Diagram of Regulation of mitotic cell cycle.png | 2025-05-14 16:58 | 2.3K | |
| Diagram of Regulation of mRNA stability by proteins that bind AU-rich elements.png | 2025-05-14 16:58 | 179K | |
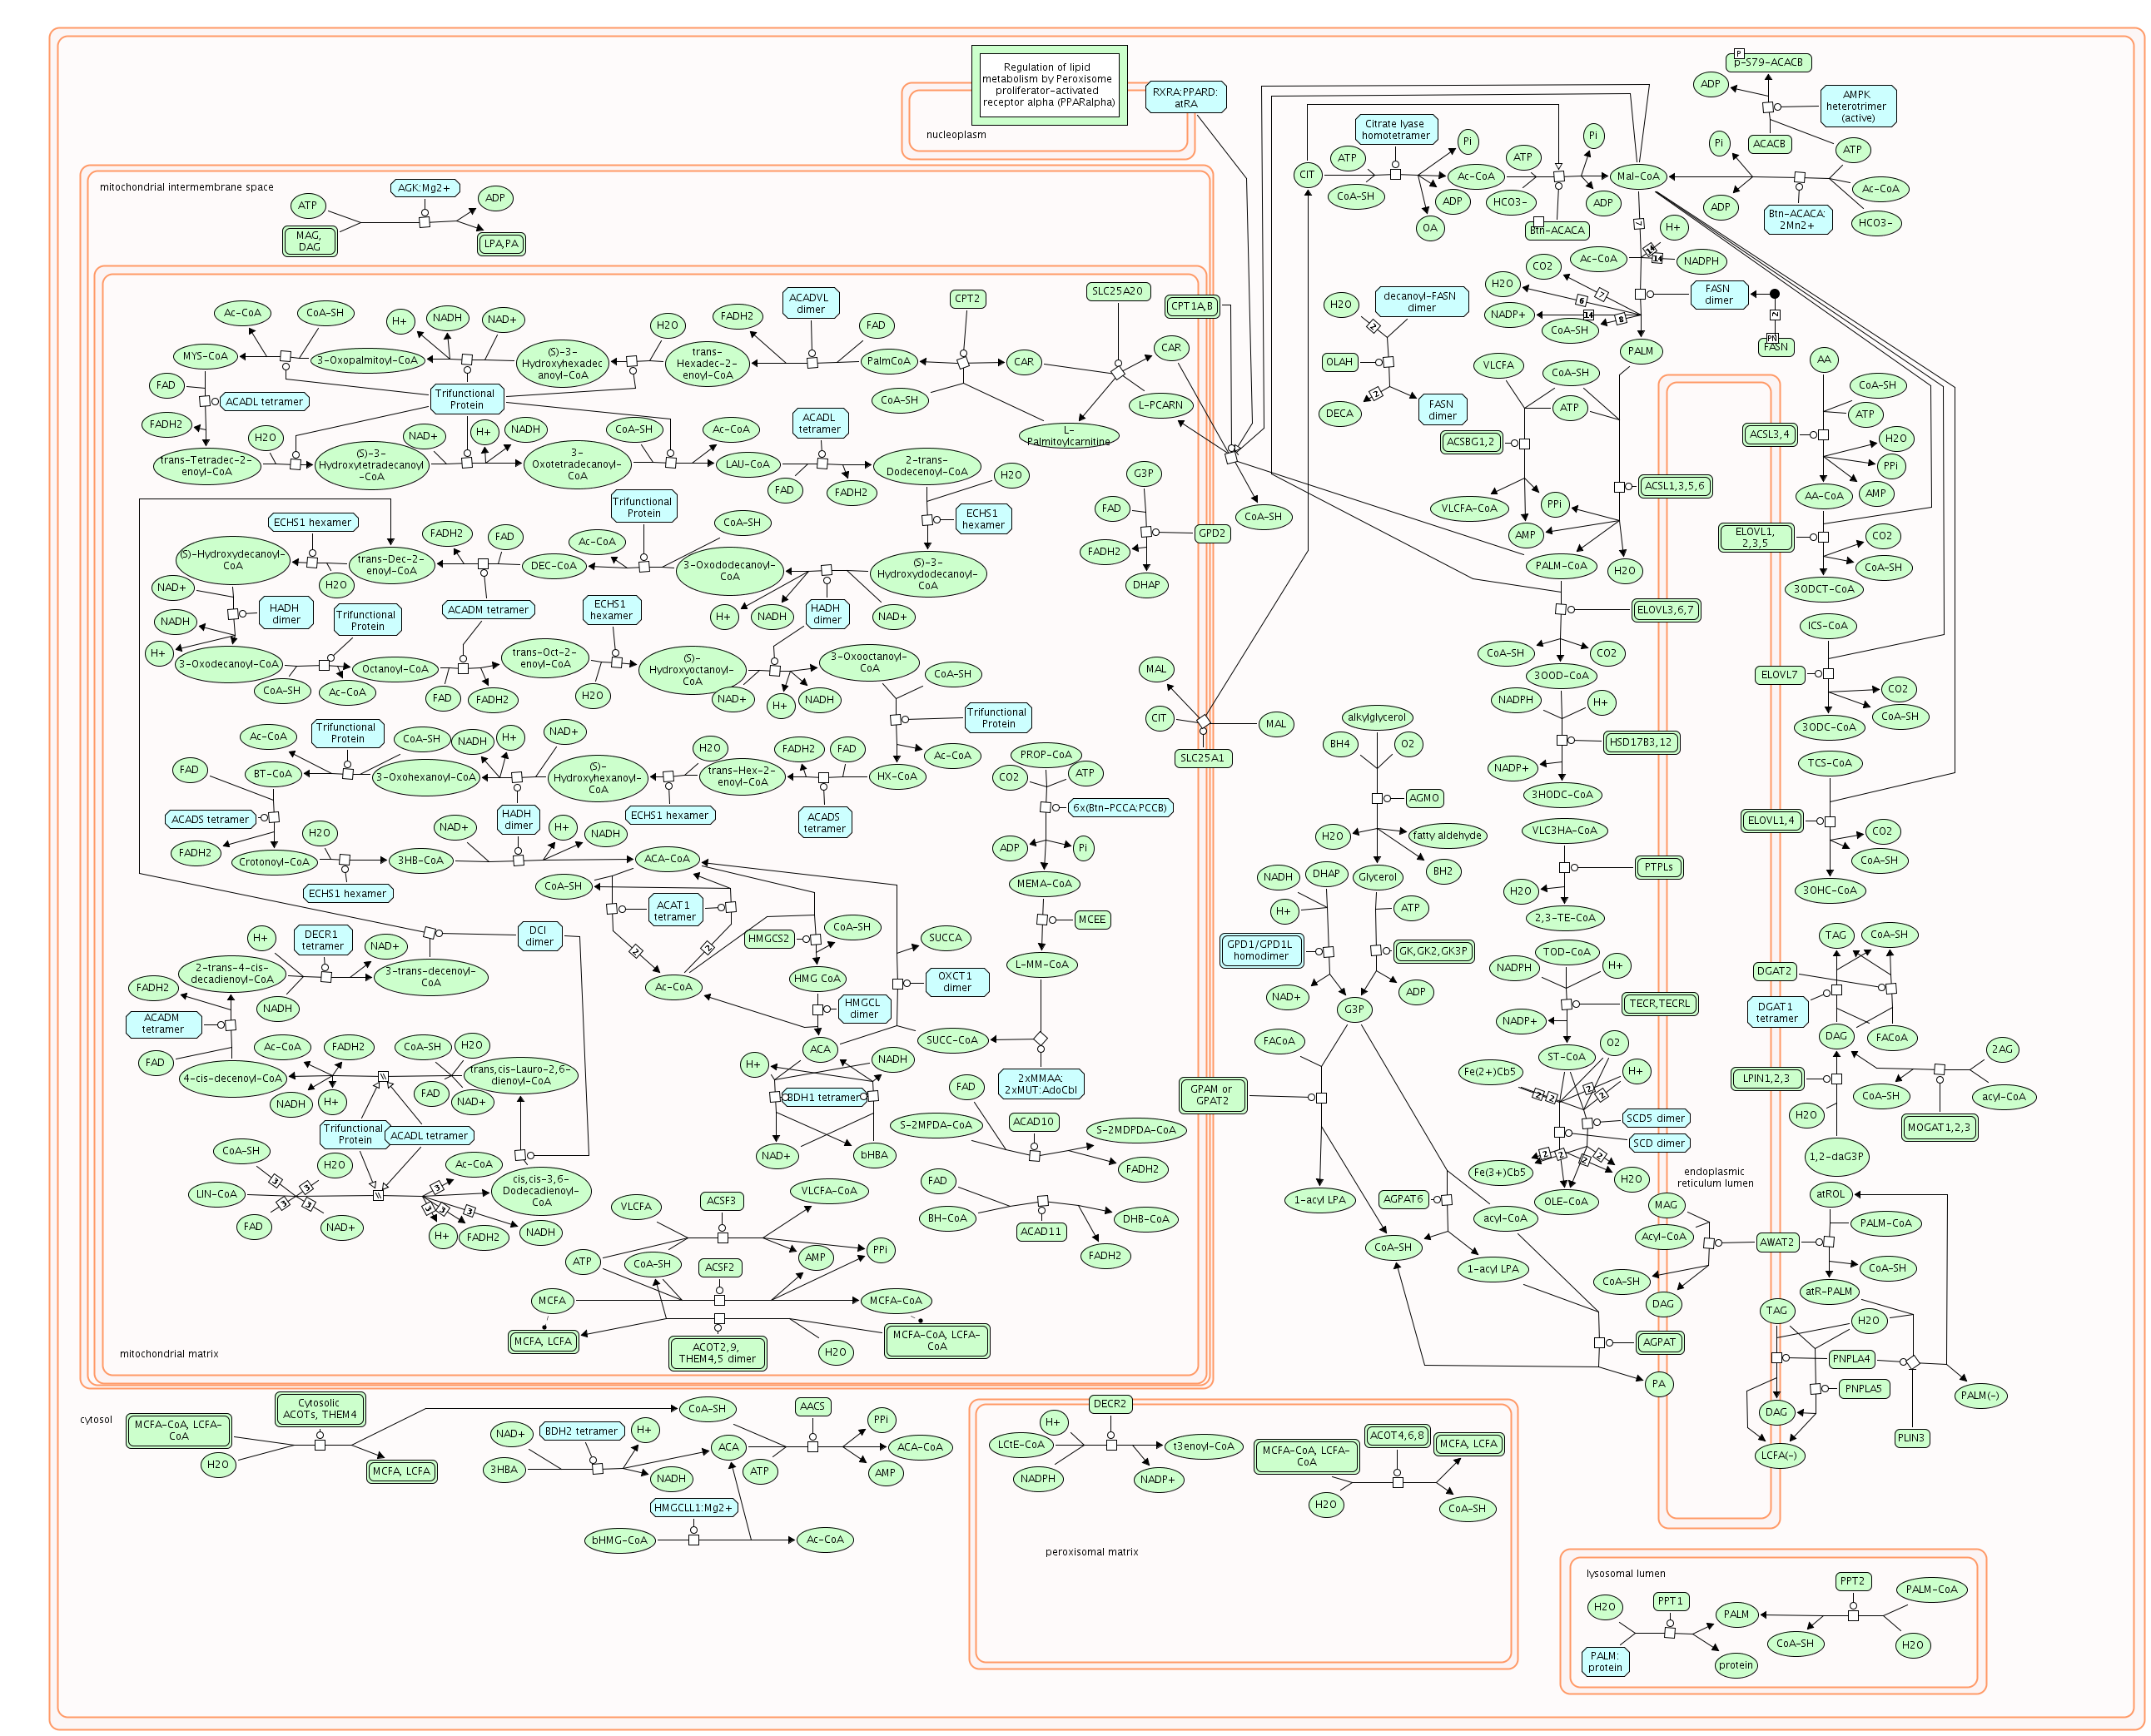
| Diagram of Regulation of lipid metabolism by Peroxisome proliferator-activated receptor alpha (PPARalpha).png | 2025-05-14 16:59 | 440K | |
| Diagram of Regulation of cholesterol biosynthesis by SREBP (SREBF).png | 2025-05-14 16:56 | 61K | |
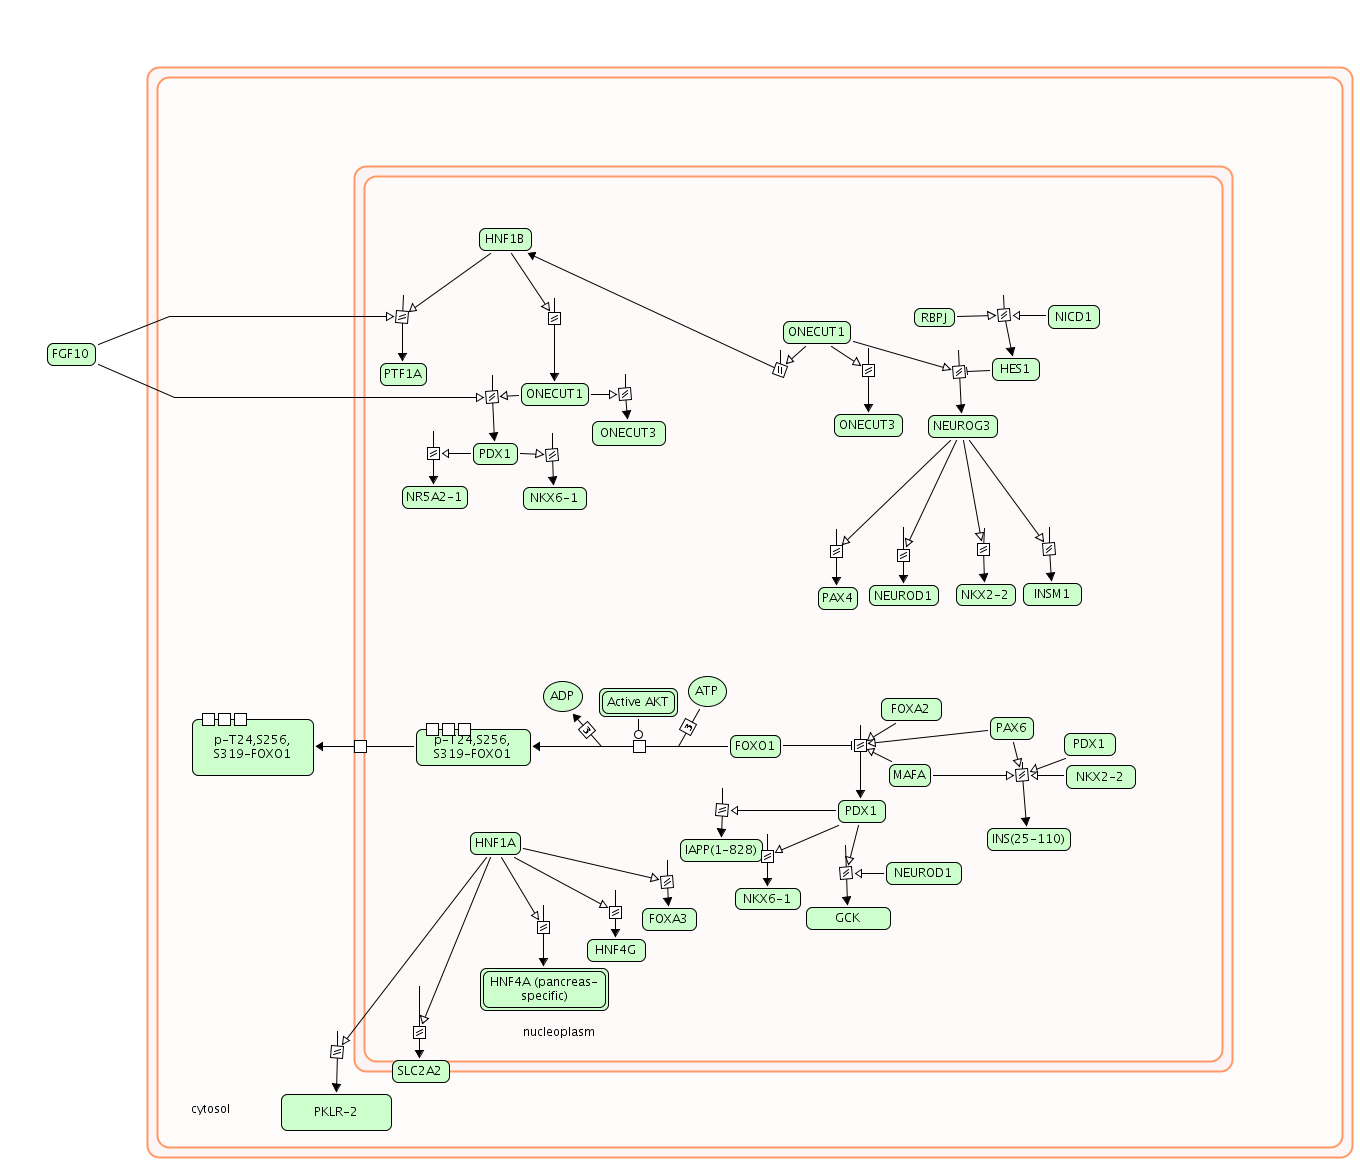
| Diagram of Regulation of beta-cell development.png | 2025-05-14 16:57 | 81K | |
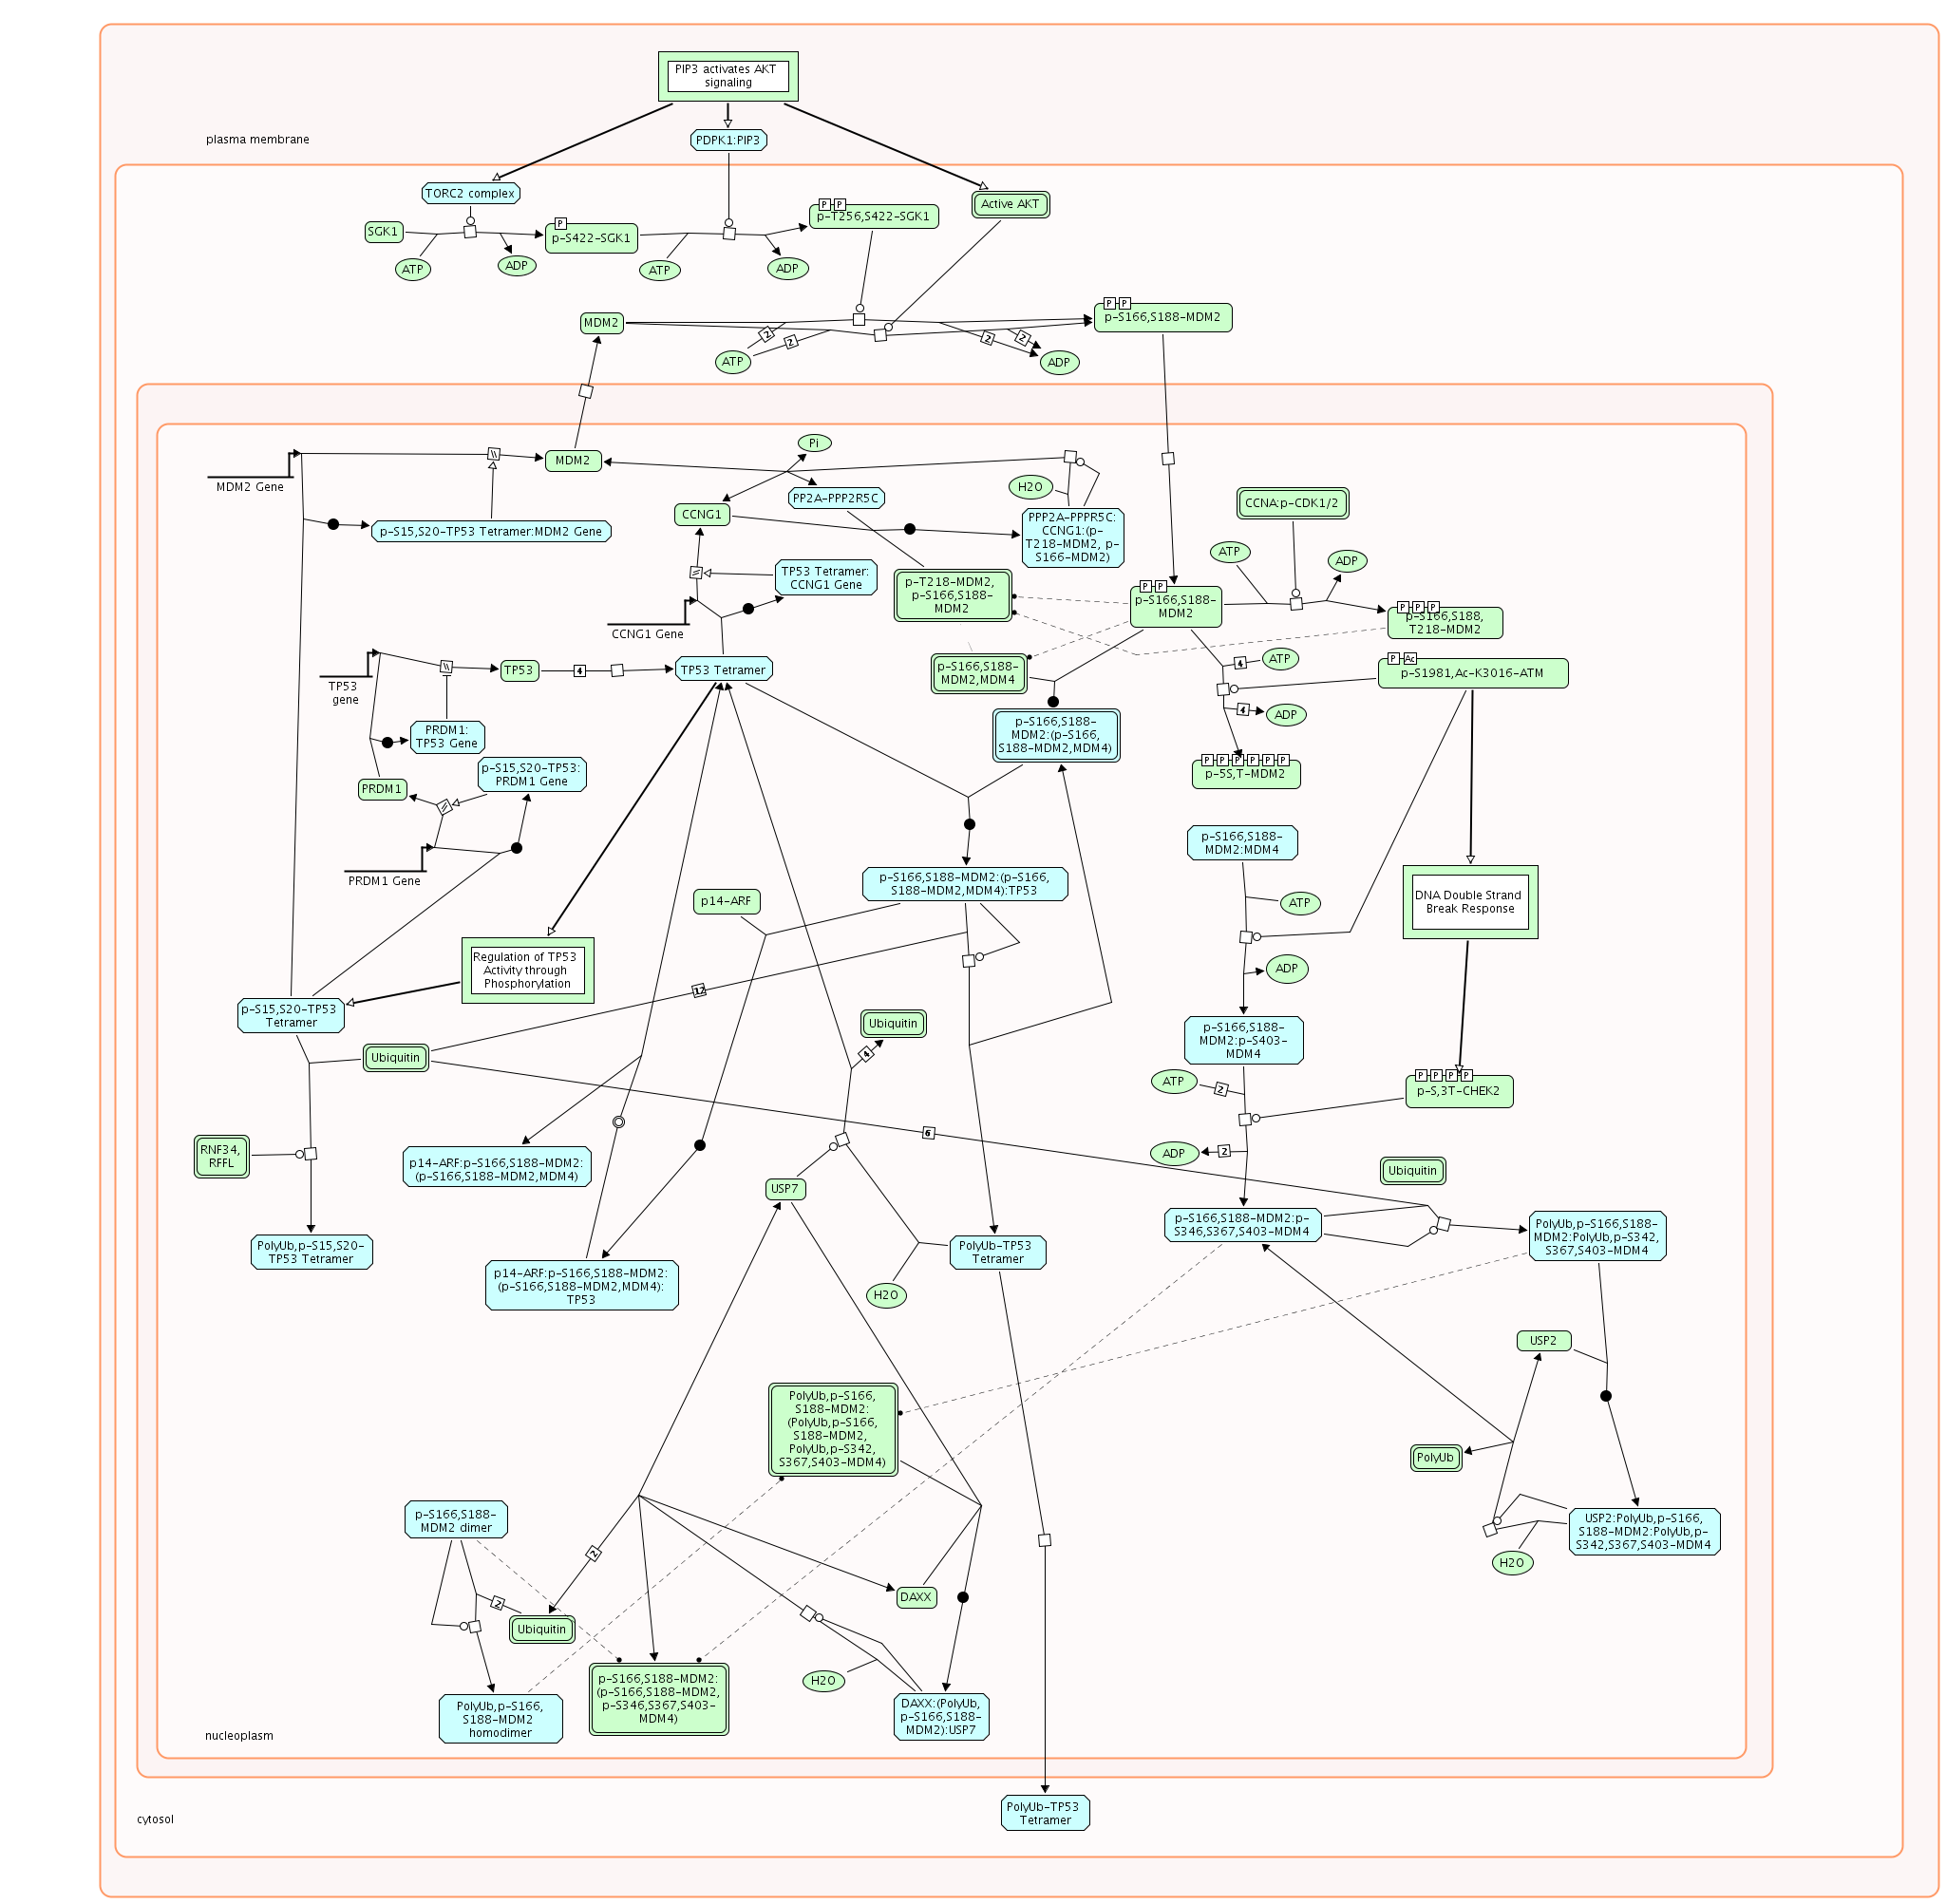
| Diagram of Regulation of TP53 Expression and Degradation.png | 2025-05-14 16:57 | 301K | |
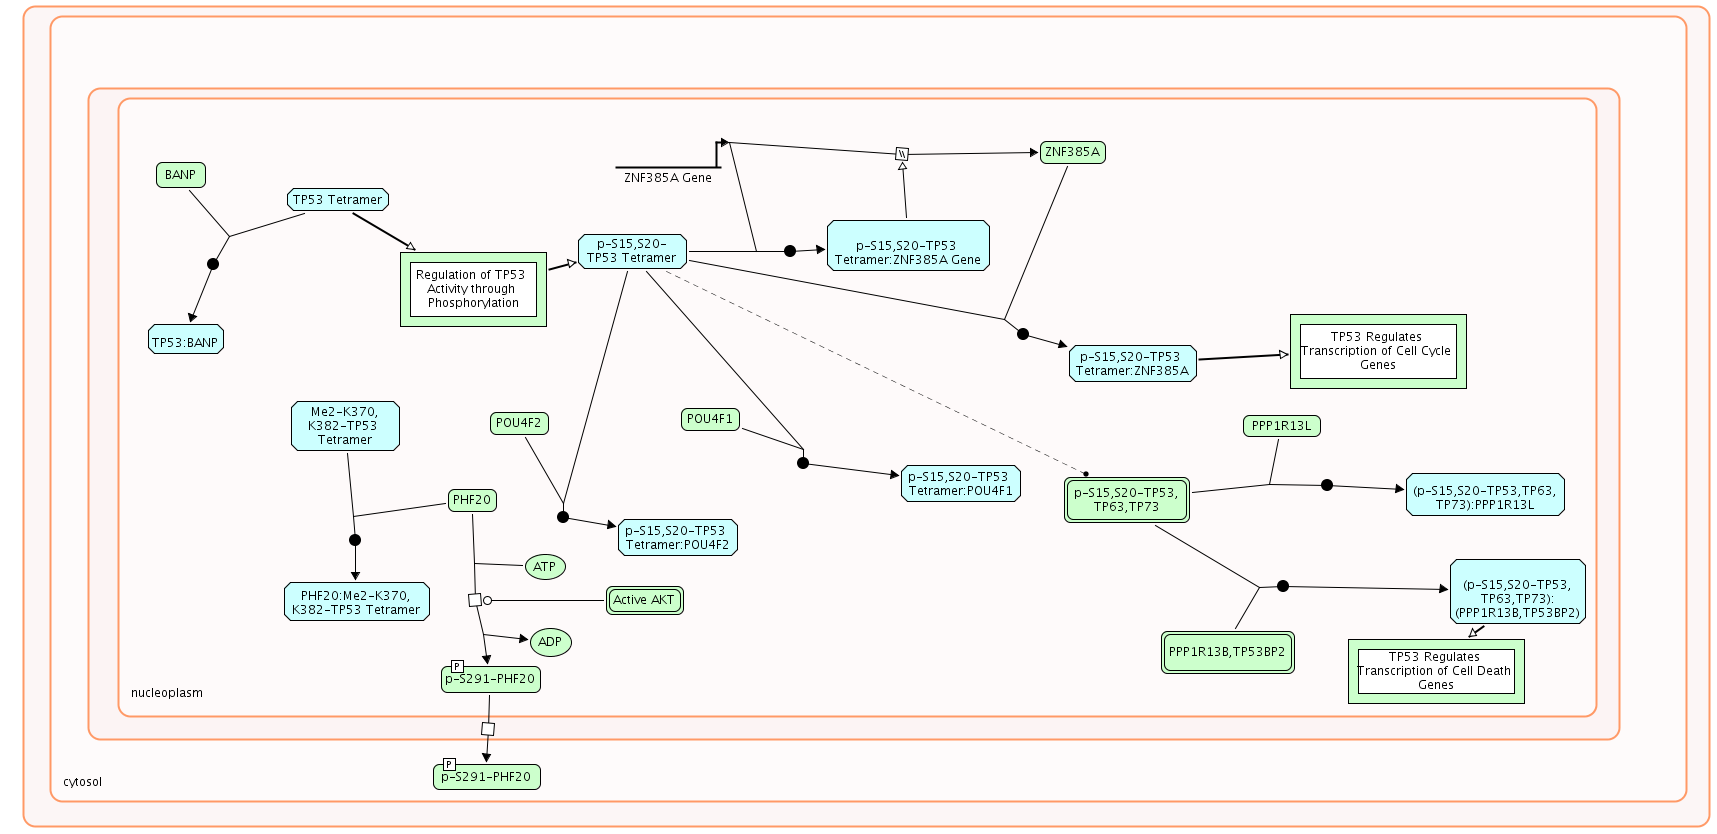
| Diagram of Regulation of TP53 Activity through Phosphorylation.png | 2025-05-14 17:00 | 215K | |
| Diagram of Regulation of TP53 Activity through Methylation.png | 2025-05-14 16:56 | 87K | |
| Diagram of Regulation of TP53 Activity through Association with Co-factors.png | 2025-05-14 16:56 | 80K | |
| Diagram of Regulation of TP53 Activity through Acetylation.png | 2025-05-14 16:57 | 72K | |
| Diagram of Regulation of TP53 Activity.png | 2025-05-14 16:56 | 5.6K | |
| Diagram of Regulation of Insulin-like Growth Factor (IGF) transport and uptake by Insulin-like Growth Factor Binding Proteins (IGFBPs).png | 2025-05-14 16:59 | 194K | |
| Diagram of Regulation of Hypoxia-inducible Factor (HIF) by oxygen.png | 2025-05-14 17:00 | 170K | |
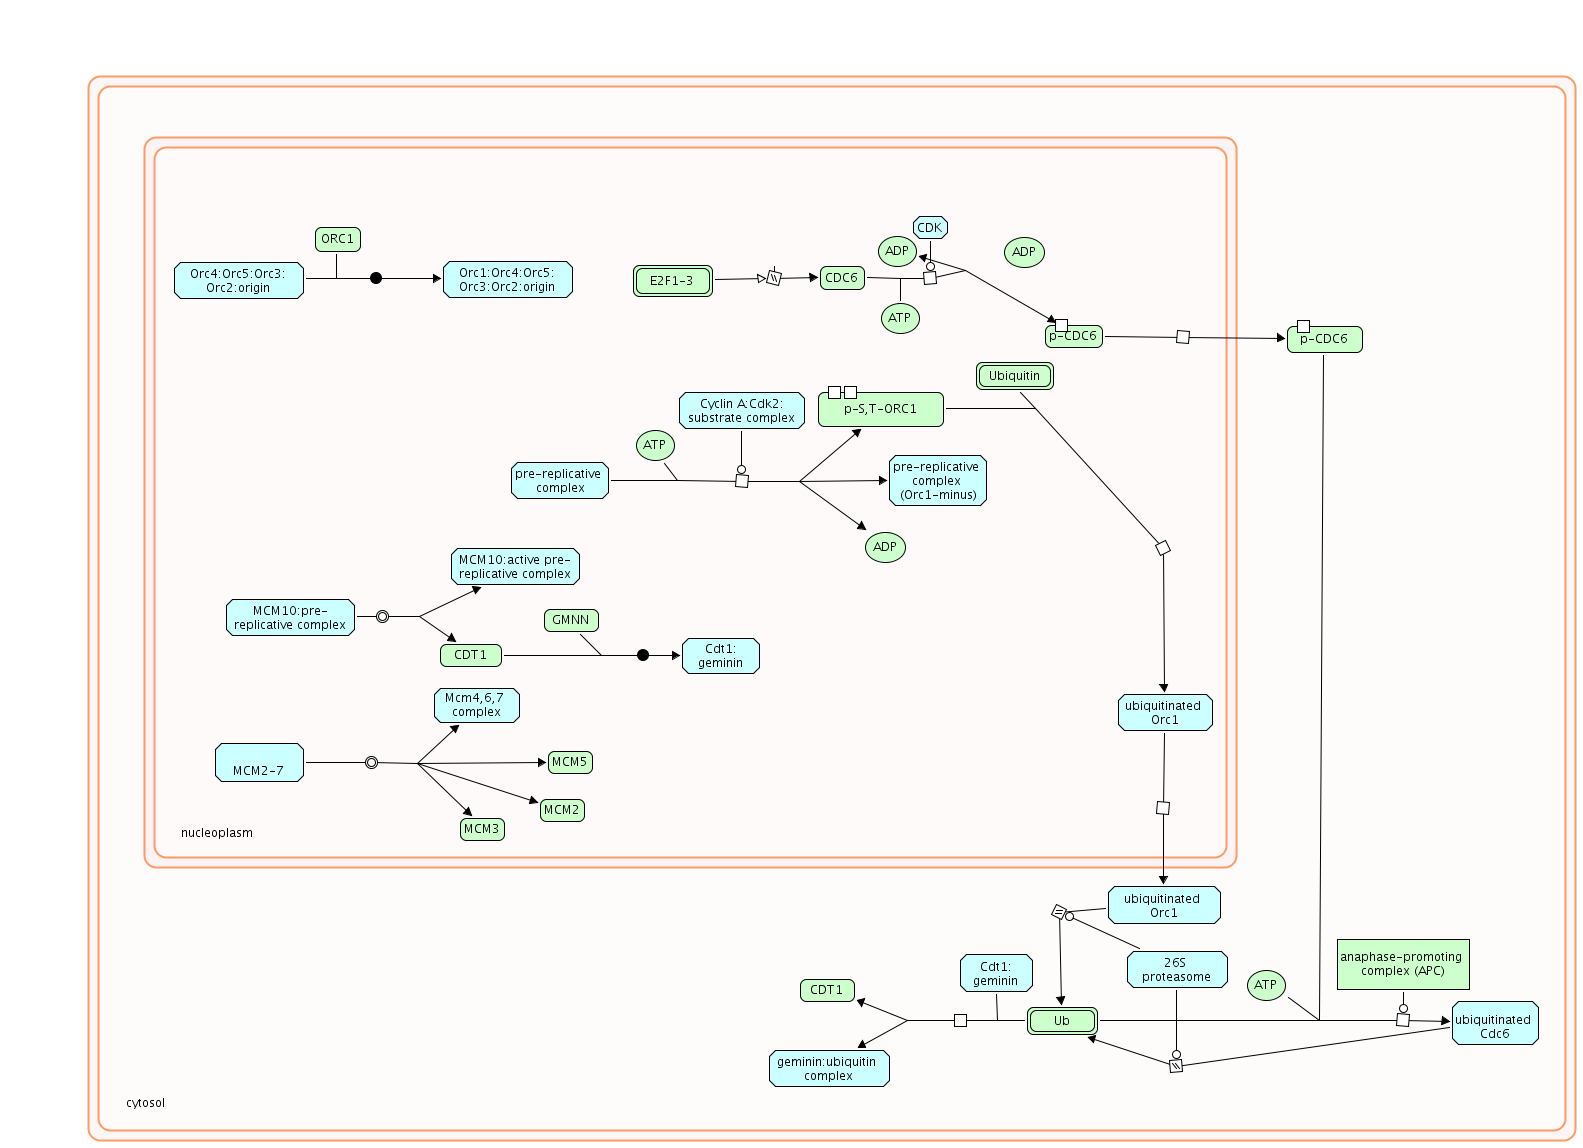
| Diagram of Regulation of DNA replication.png | 2025-05-14 16:58 | 84K | |
| Diagram of Regulation of Apoptosis.png | 2025-05-14 16:59 | 20K | |
| Diagram of Regulated Necrosis.png | 2025-05-14 16:56 | 73K | |
| Diagram of Rap1 signalling.png | 2025-05-14 16:58 | 48K | |
| Diagram of ROS.png | 2025-05-14 17:00 | 168K | |
| Diagram of ROS, RNS production in response to bacteria.png | 2025-05-14 16:58 | 168K | |
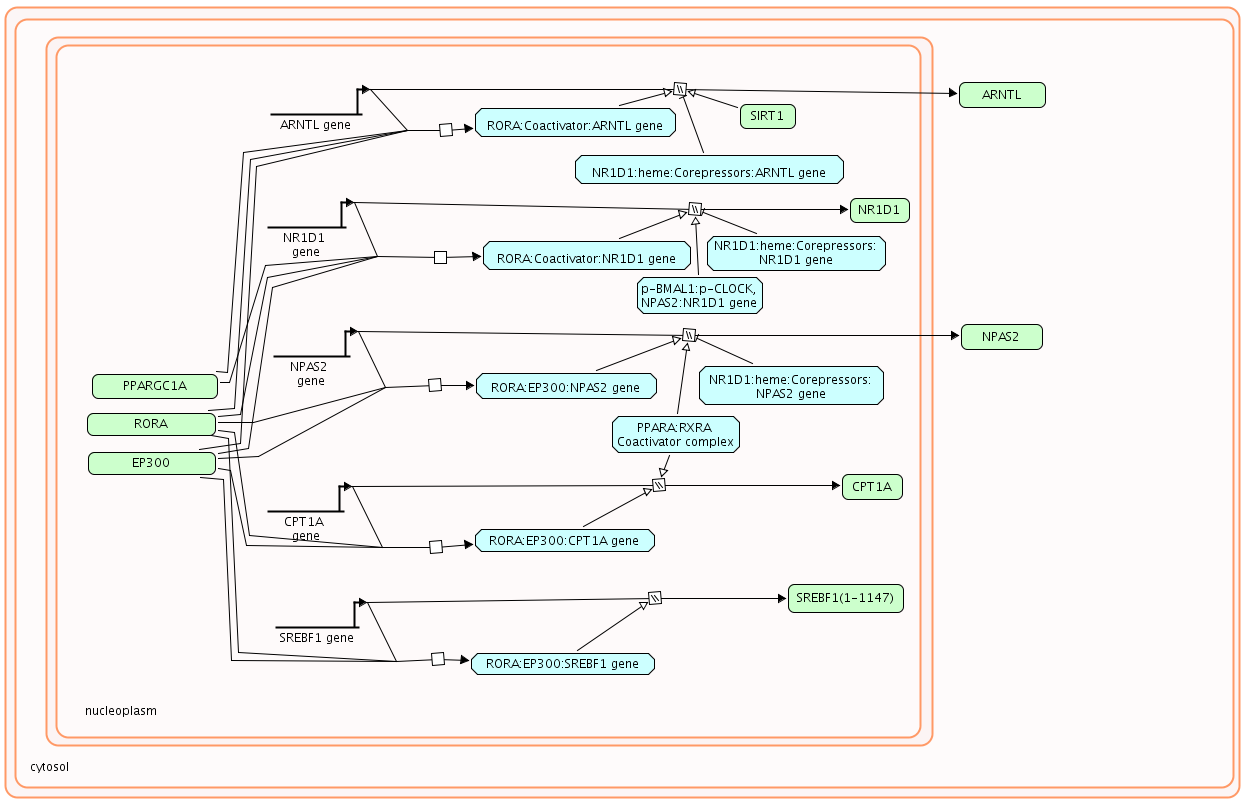
| Diagram of RORA activates gene expression.png | 2025-05-14 16:56 | 79K | |
| Diagram of RNS production in response to bacteria.png | 2025-05-14 16:56 | 168K | |
| Diagram of RNF mutants show enhanced WNT signaling proliferation.png | 2025-05-14 17:01 | 492K | |
| Diagram of RNA polymerase II transcribes snRNA genes.png | 2025-05-14 16:58 | 107K | |
| Diagram of RNA Polymerase II Transcription.png | 2025-05-14 16:57 | 309K | |
| Diagram of RNA Polymerase III.png | 2025-05-14 16:57 | 276K | |
| Diagram of RNA Polymerase I.png | 2025-05-14 16:58 | 276K | |
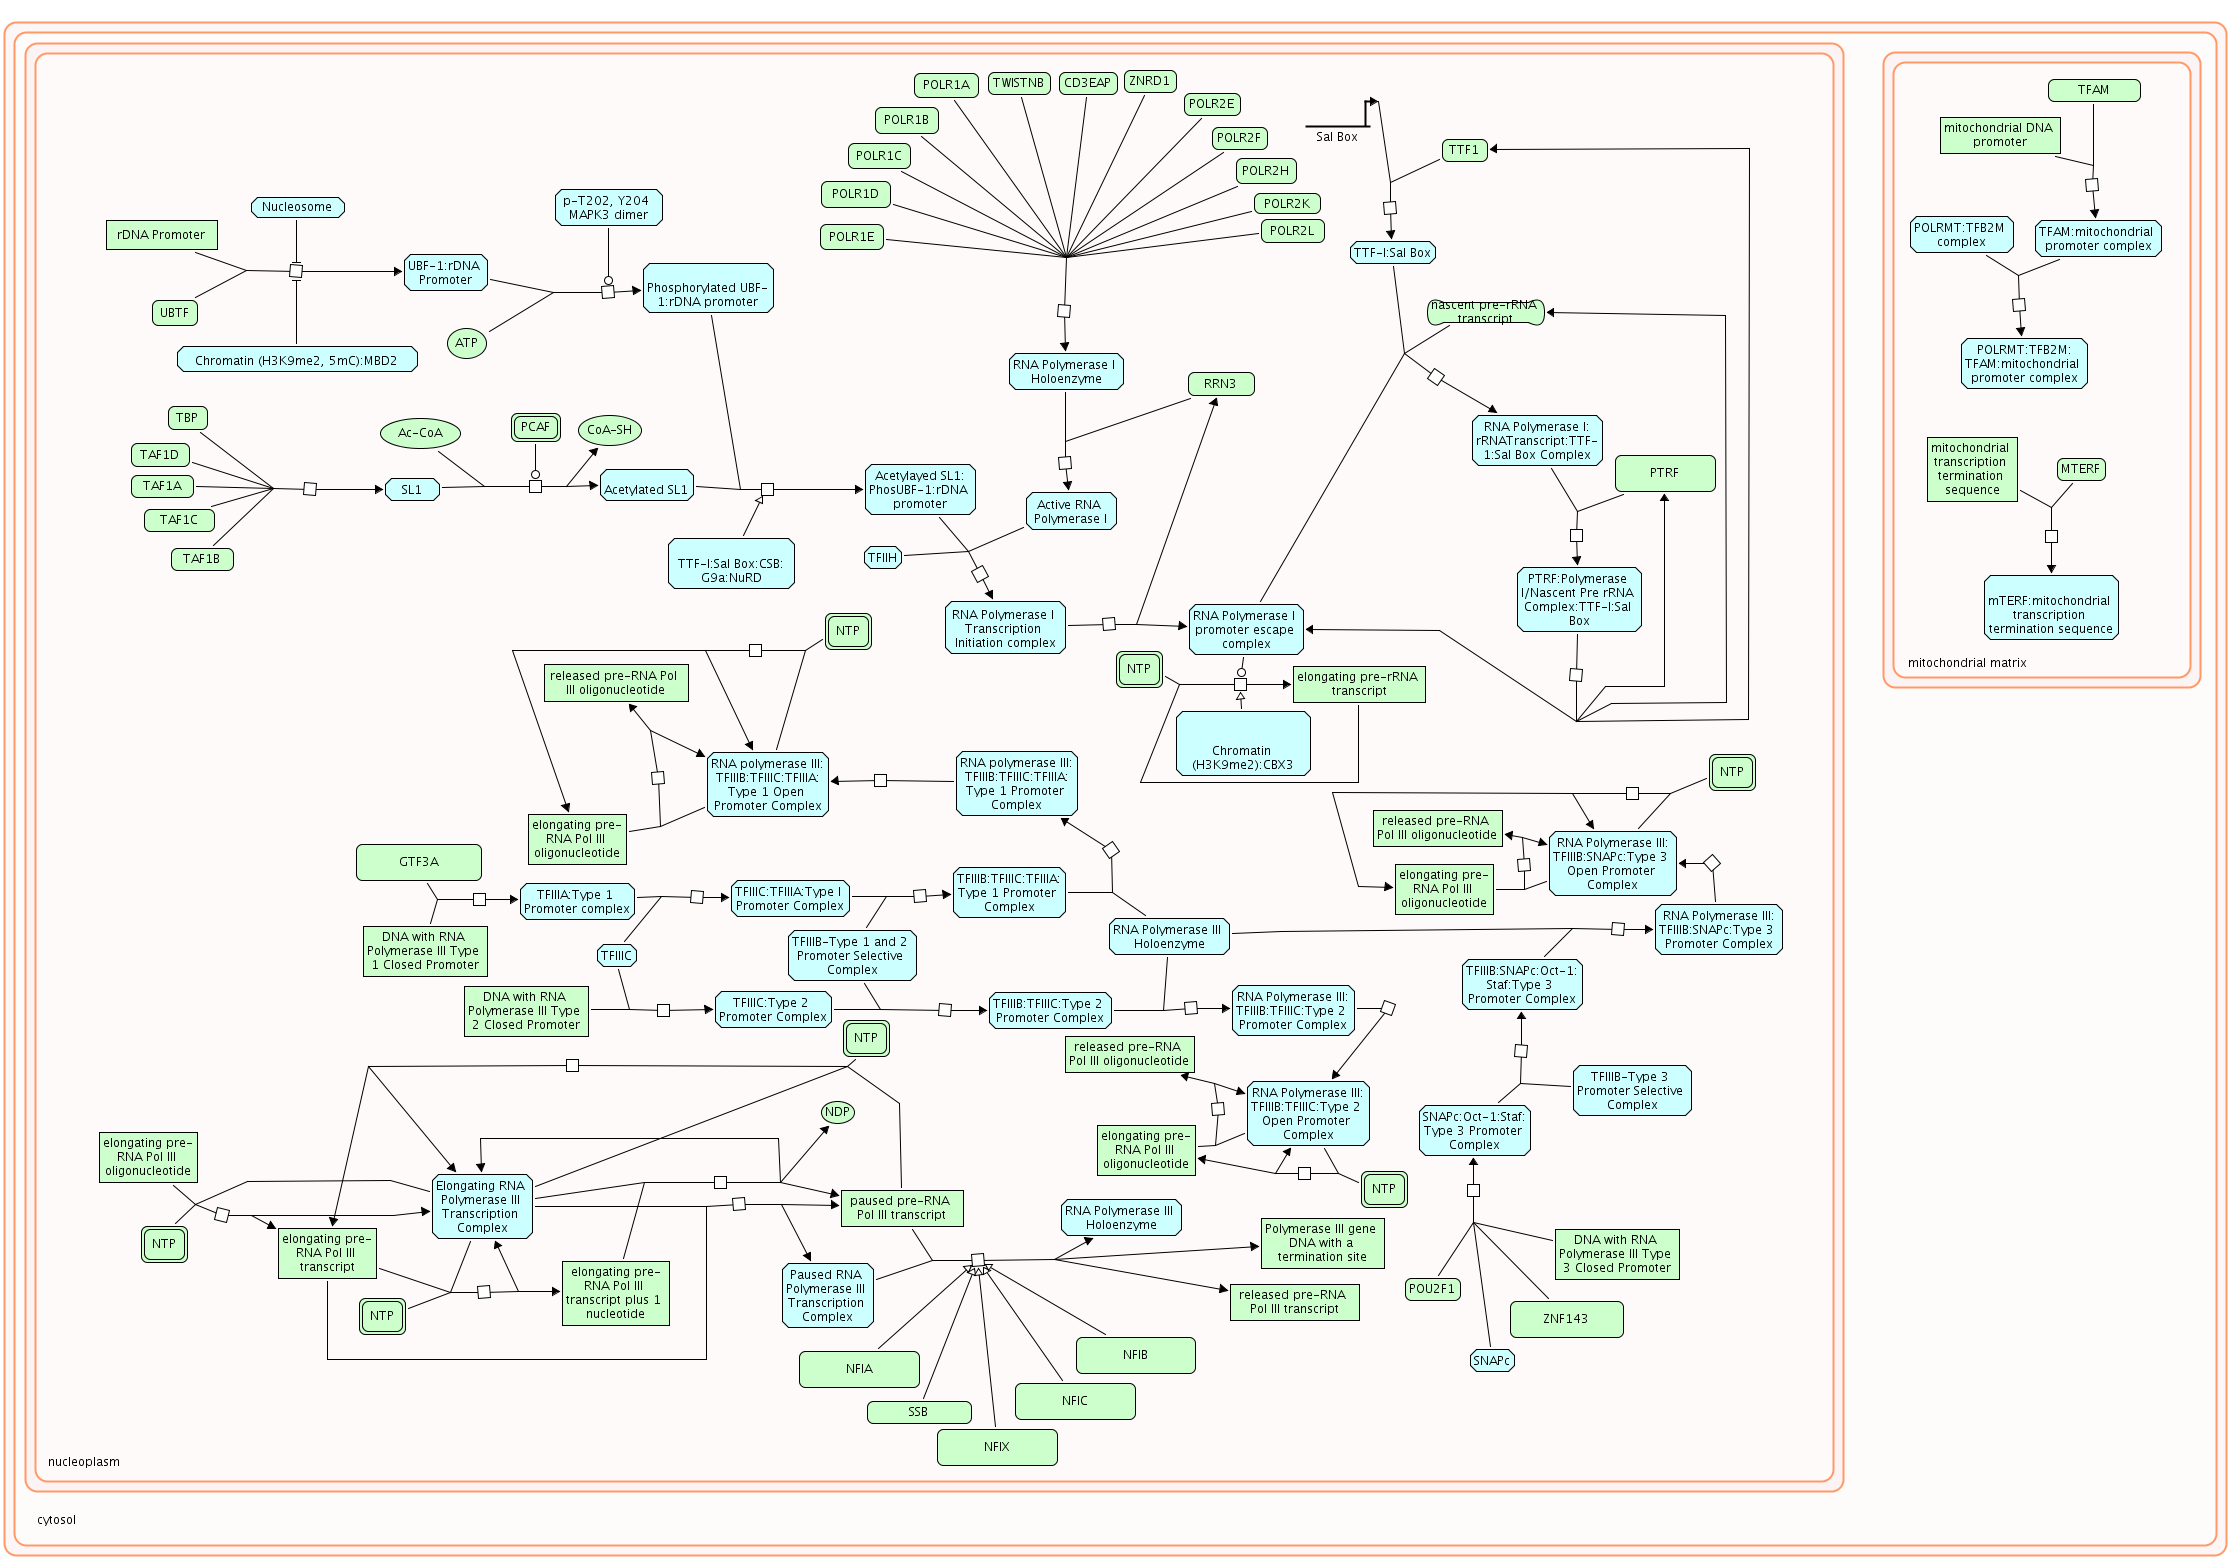
| Diagram of RNA Polymerase I, RNA Polymerase III, and Mitochondrial Transcription.png | 2025-05-14 17:00 | 276K | |
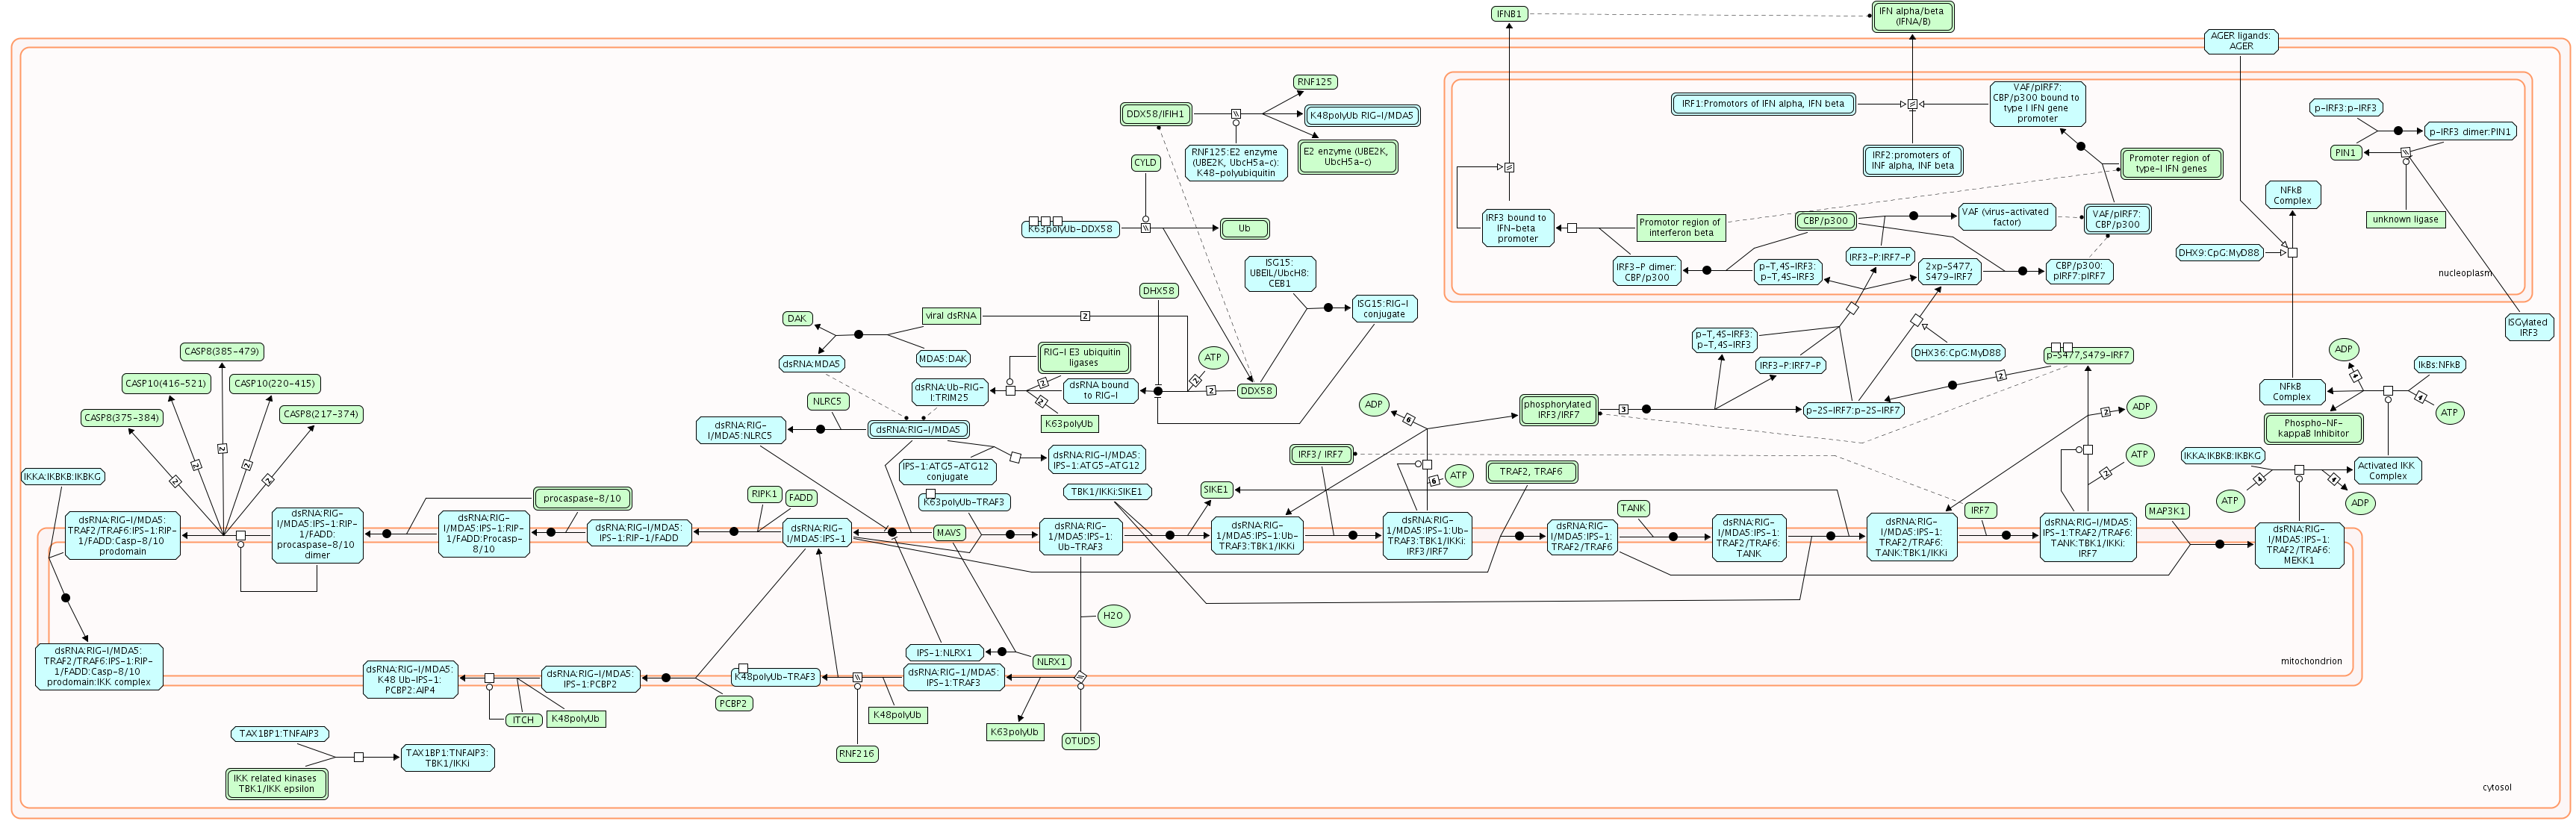
| Diagram of RIG-I-MDA5 mediated induction of IFN-alpha-beta pathways.png | 2025-05-14 17:01 | 256K | |
| Diagram of RHO GTPases regulate CFTR trafficking.png | 2025-05-14 16:56 | 17K | |
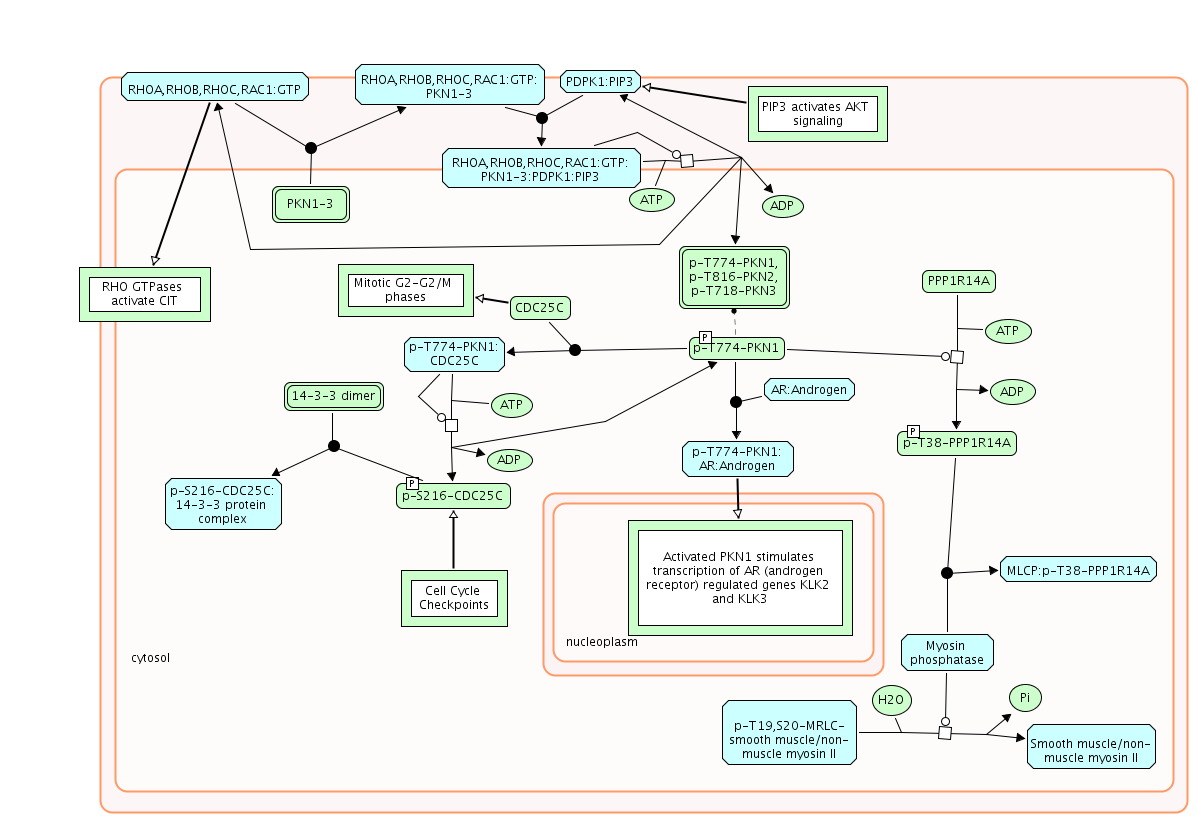
| Diagram of RHO GTPases activate PKNs.png | 2025-05-14 17:00 | 78K | |
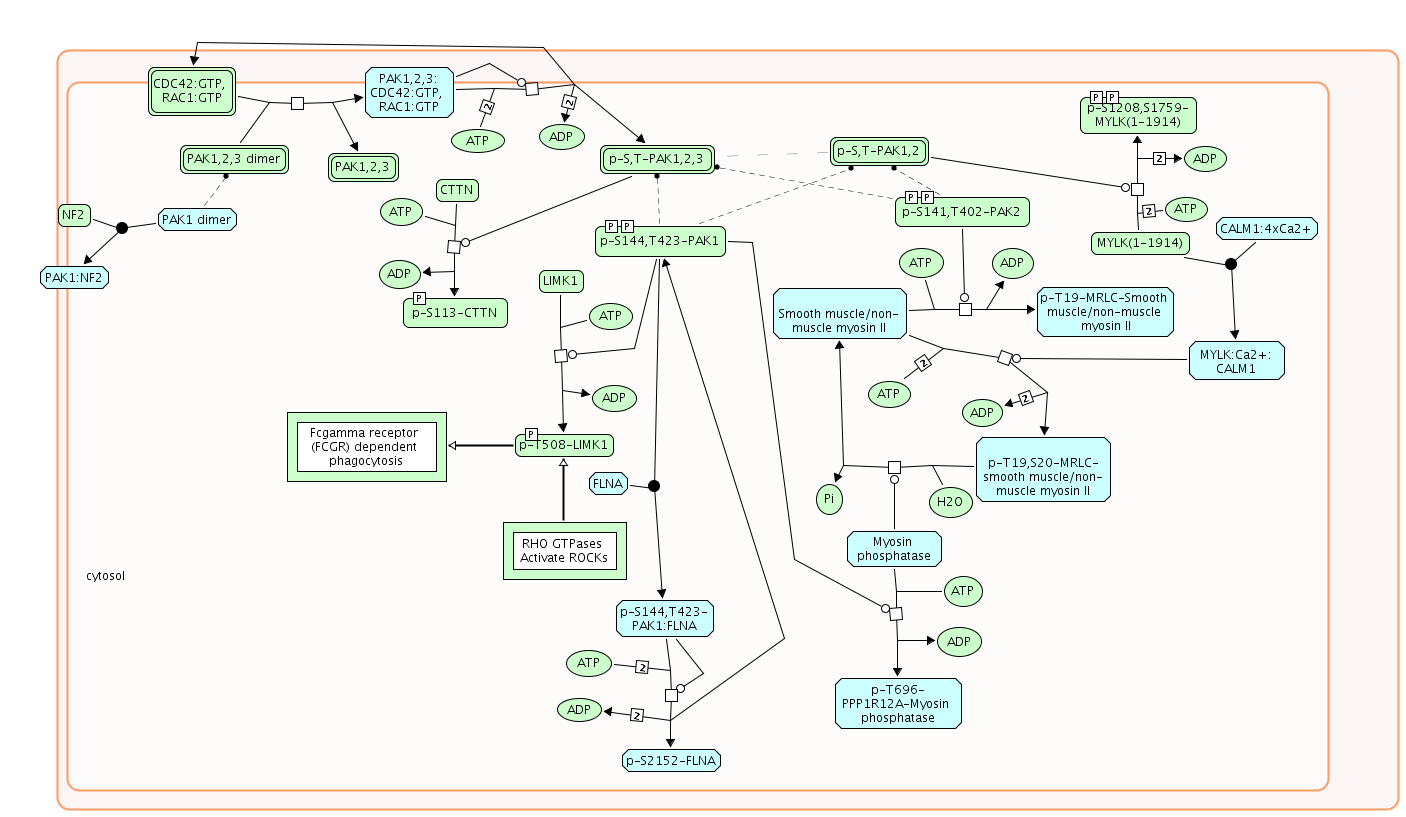
| Diagram of RHO GTPases activate PAKs.png | 2025-05-14 16:57 | 104K | |
| Diagram of RHO GTPases activate KTN1.png | 2025-05-14 16:57 | 15K | |
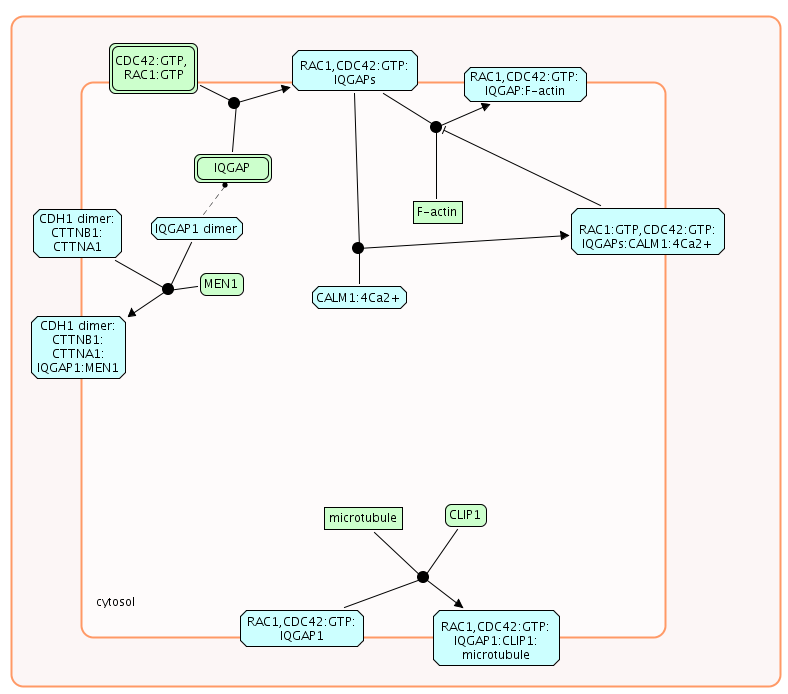
| Diagram of RHO GTPases activate IQGAPs.png | 2025-05-14 16:56 | 31K | |
| Diagram of RHO GTPases activate CIT.png | 2025-05-14 16:57 | 34K | |
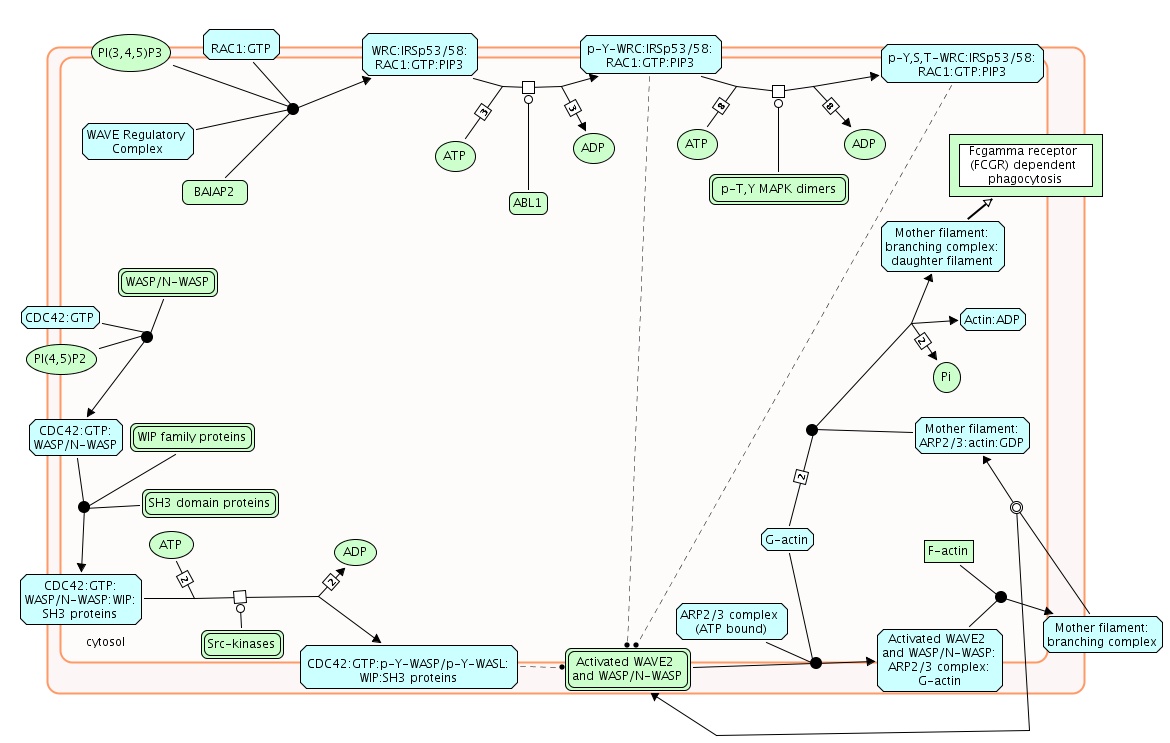
| Diagram of RHO GTPases Activate WASPs and WAVEs.png | 2025-05-14 16:58 | 84K | |
| Diagram of RHO GTPases Activate Rhotekin and Rhophilins.png | 2025-05-14 16:59 | 24K | |
| Diagram of RHO GTPases Activate ROCKs.png | 2025-05-14 16:56 | 42K | |
| Diagram of RHO GTPases Activate NADPH Oxidases.png | 2025-05-14 16:58 | 65K | |
| Diagram of RHO GTPases Activate Formins.png | 2025-05-14 17:00 | 118K | |
| Diagram of RHO GTPase Effectors.png | 2025-05-14 17:00 | 107K | |
| Diagram of RAF-independent MAPK1-3 activation.png | 2025-05-14 16:57 | 93K | |
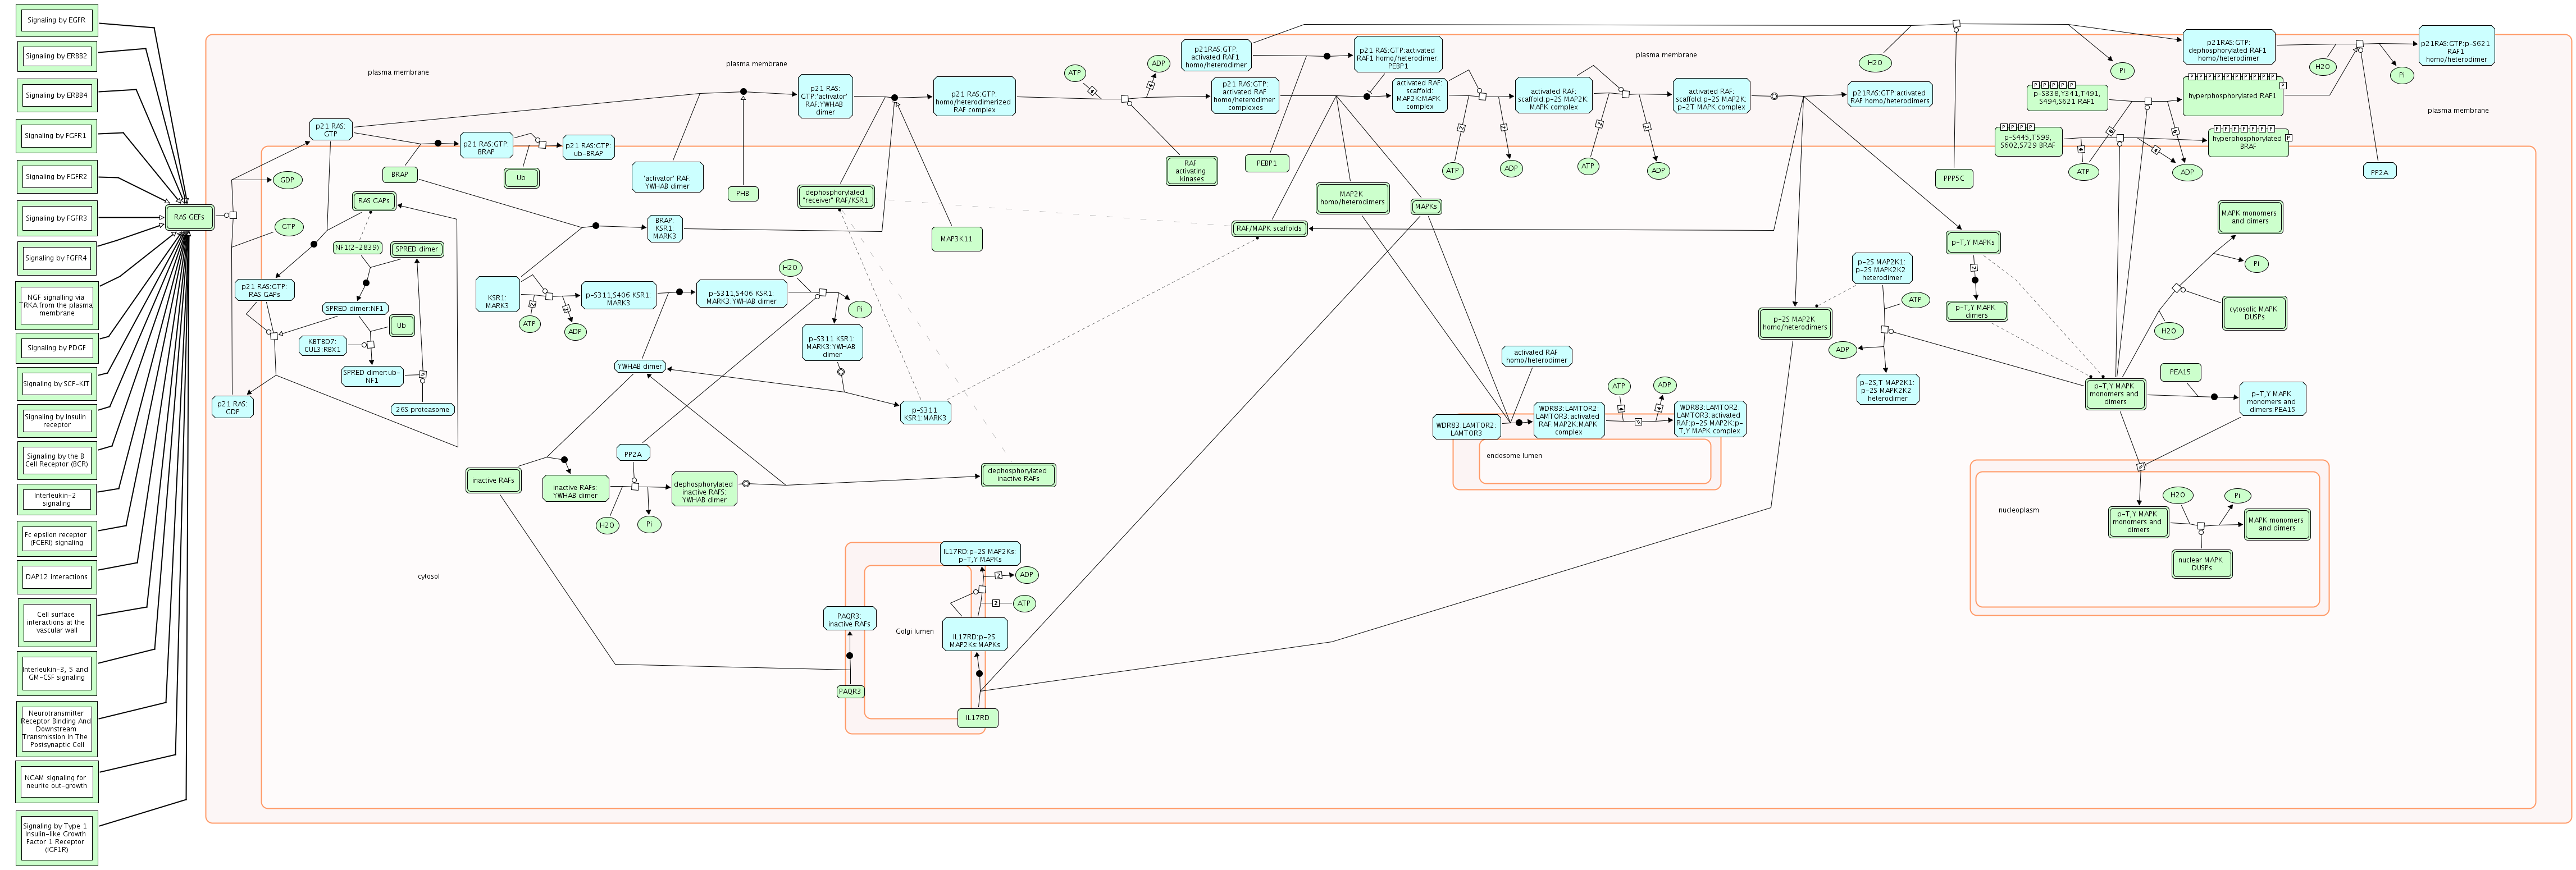
| Diagram of RAF-MAP kinase cascade.png | 2025-05-14 16:55 | 513K | |
| Diagram of RAF-MAP kinase cascade, Signaling by RAS mutants, Signaling by high-kinase activity BRAF mutants, Signaling by moderate kinase activity BRAF mutants, Paradoxical activation of RAF signaling by kinase inactive BRAF, Signaling by BRAF and RAF.png | 2025-05-14 16:59 | 513K | |
| Diagram of Protein repair.png | 2025-05-14 16:55 | 40K | |
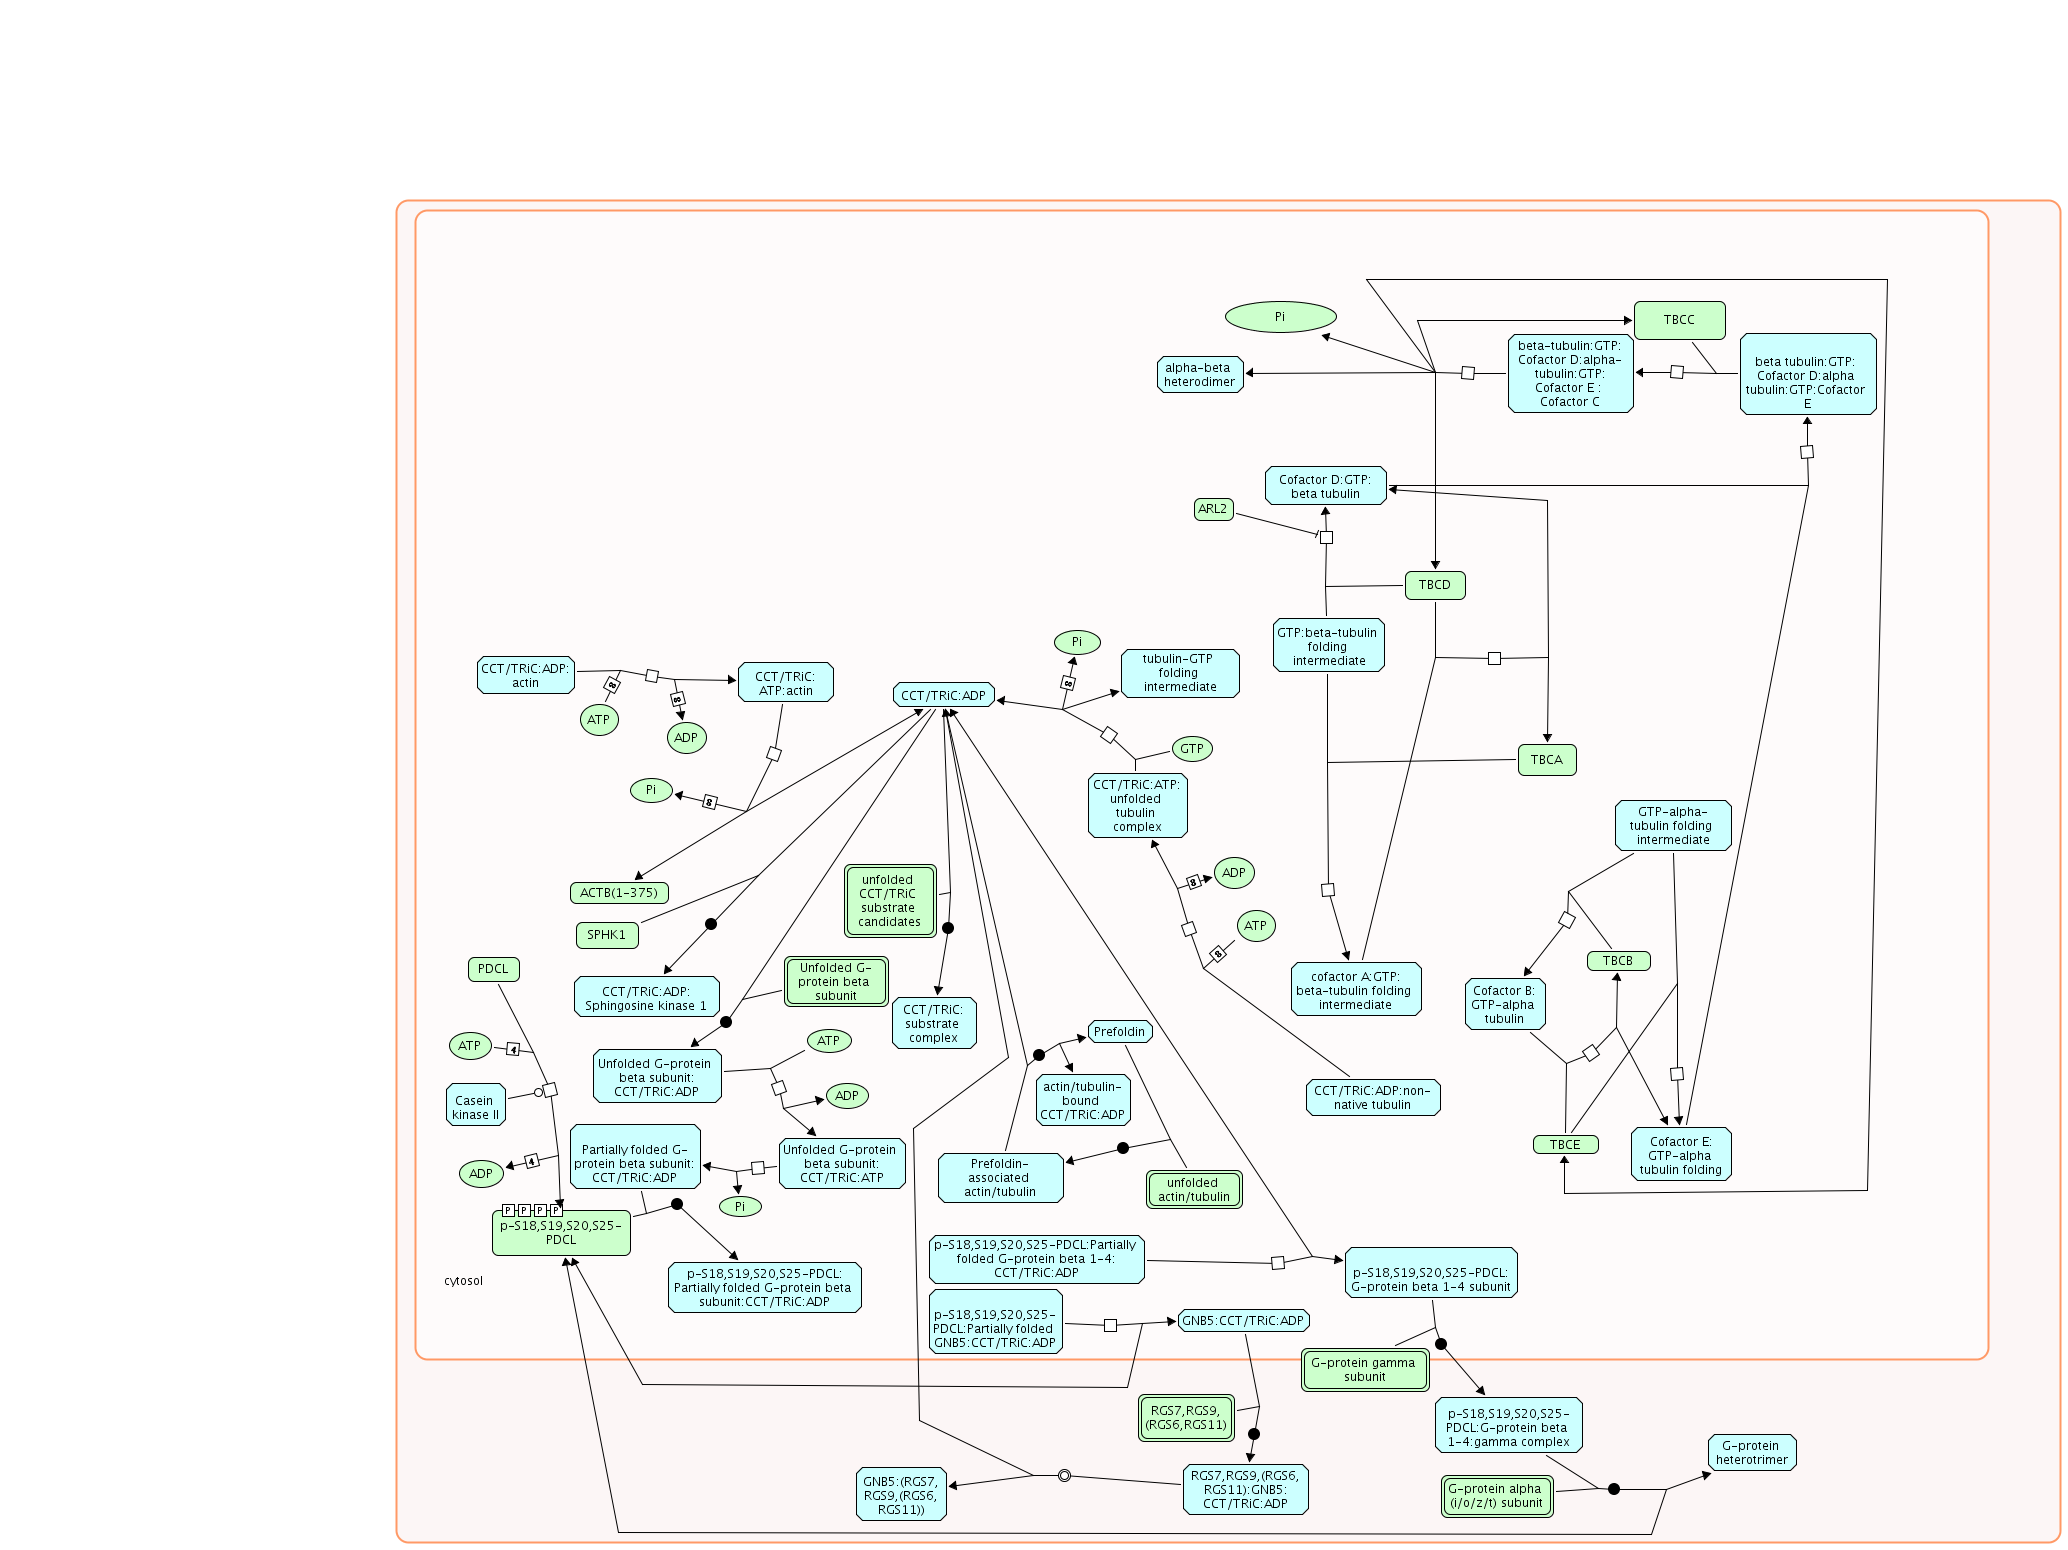
| Diagram of Protein folding.png | 2025-05-14 16:58 | 220K | |
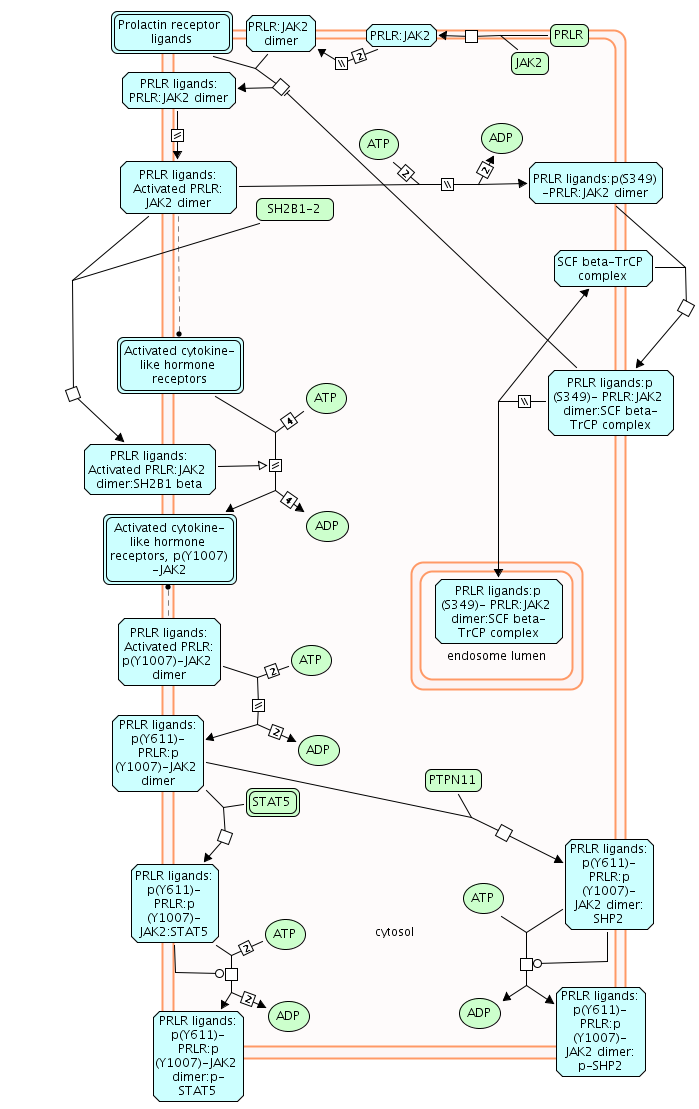
| Diagram of Prolactin receptor signaling.png | 2025-05-14 16:58 | 83K | |
| Diagram of Programmed Cell Death.png | 2025-05-14 16:56 | 4.2K | |
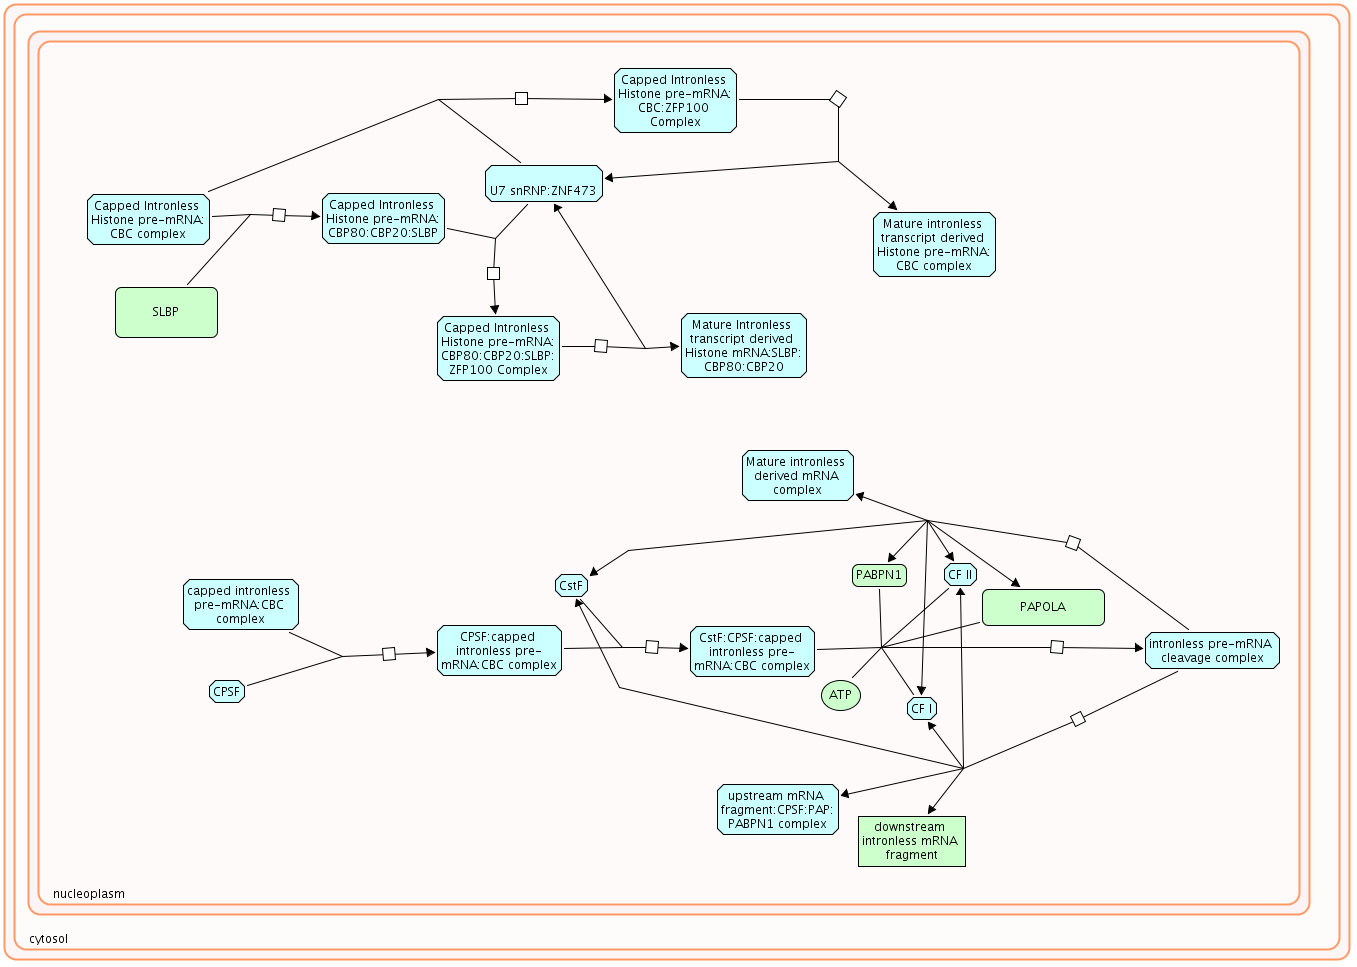
| Diagram of Processing of Capped Intronless Pre-mRNA.png | 2025-05-14 16:56 | 78K | |
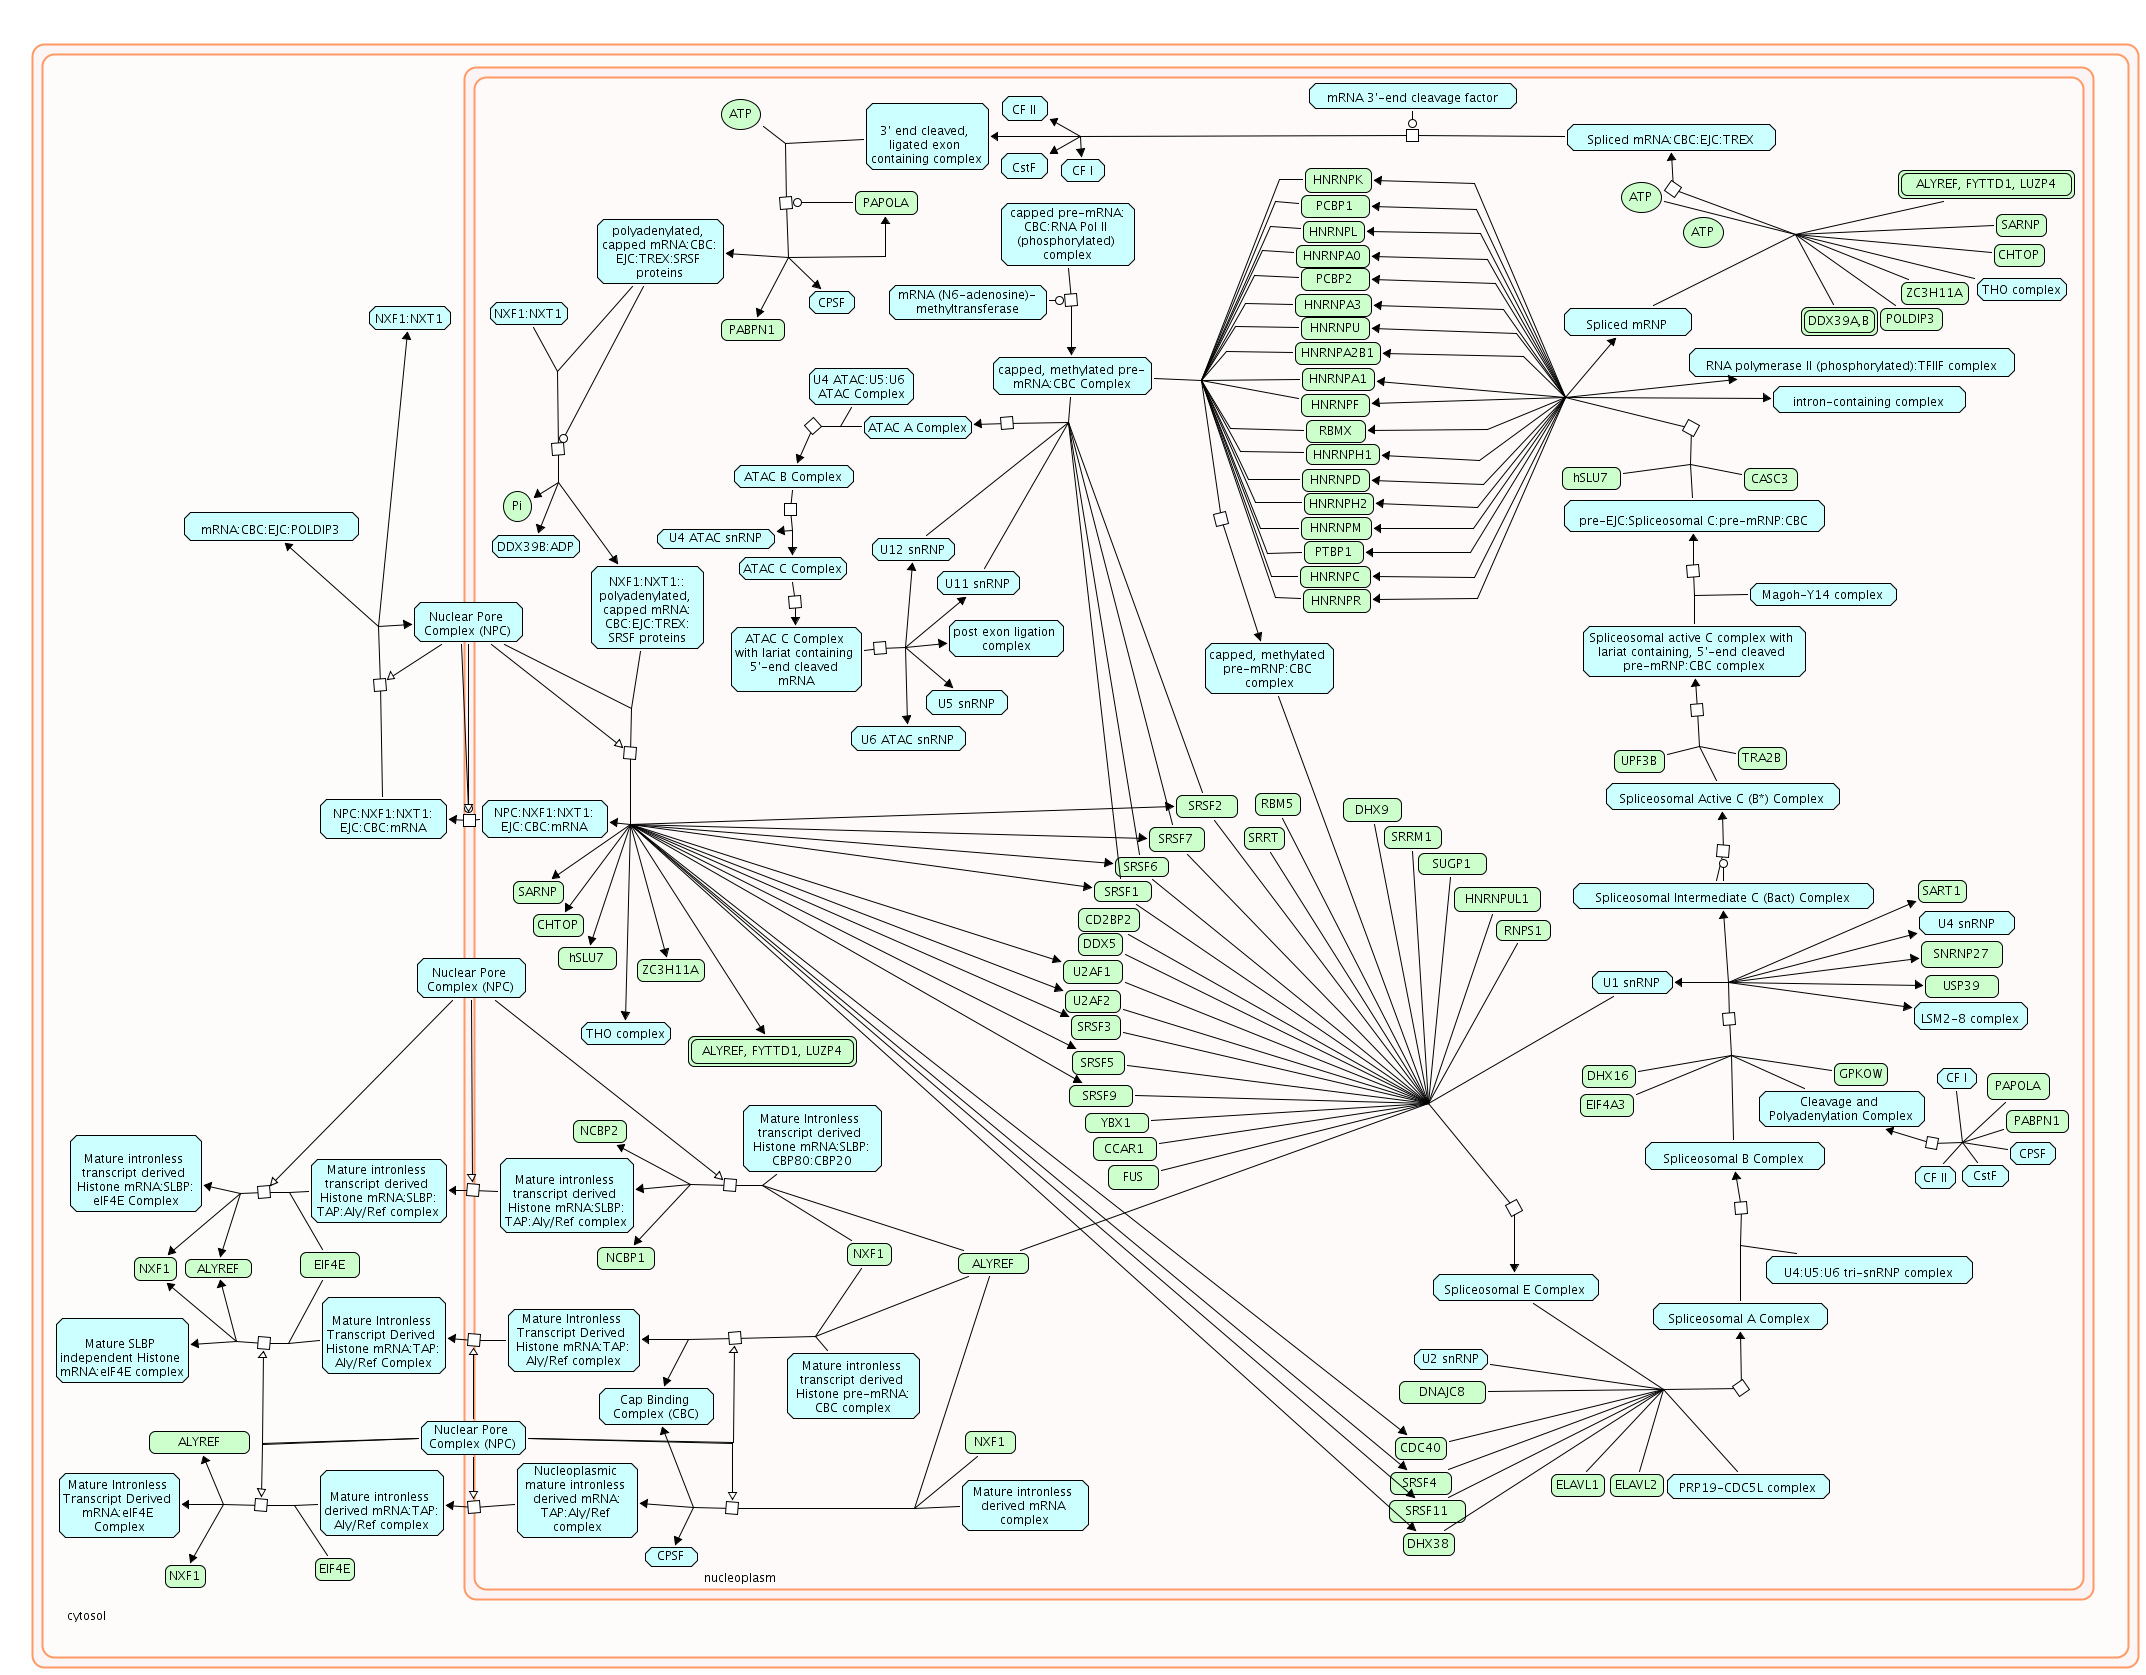
| Diagram of Processing of Capped Intron-Containing Pre-mRNA.png | 2025-05-14 16:55 | 459K | |
| Diagram of Pre-NOTCH Processing in Golgi and Defective LFNG causes SCDO3.png | 2025-05-14 16:58 | 44K | |
| Diagram of Pre-NOTCH Expression and Processing.png | 2025-05-14 16:56 | 196K | |
| Diagram of Potassium Channels.png | 2025-05-14 16:56 | 64K | |
| Diagram of Post-translational protein modification.png | 2025-05-14 16:58 | 6.2K | |
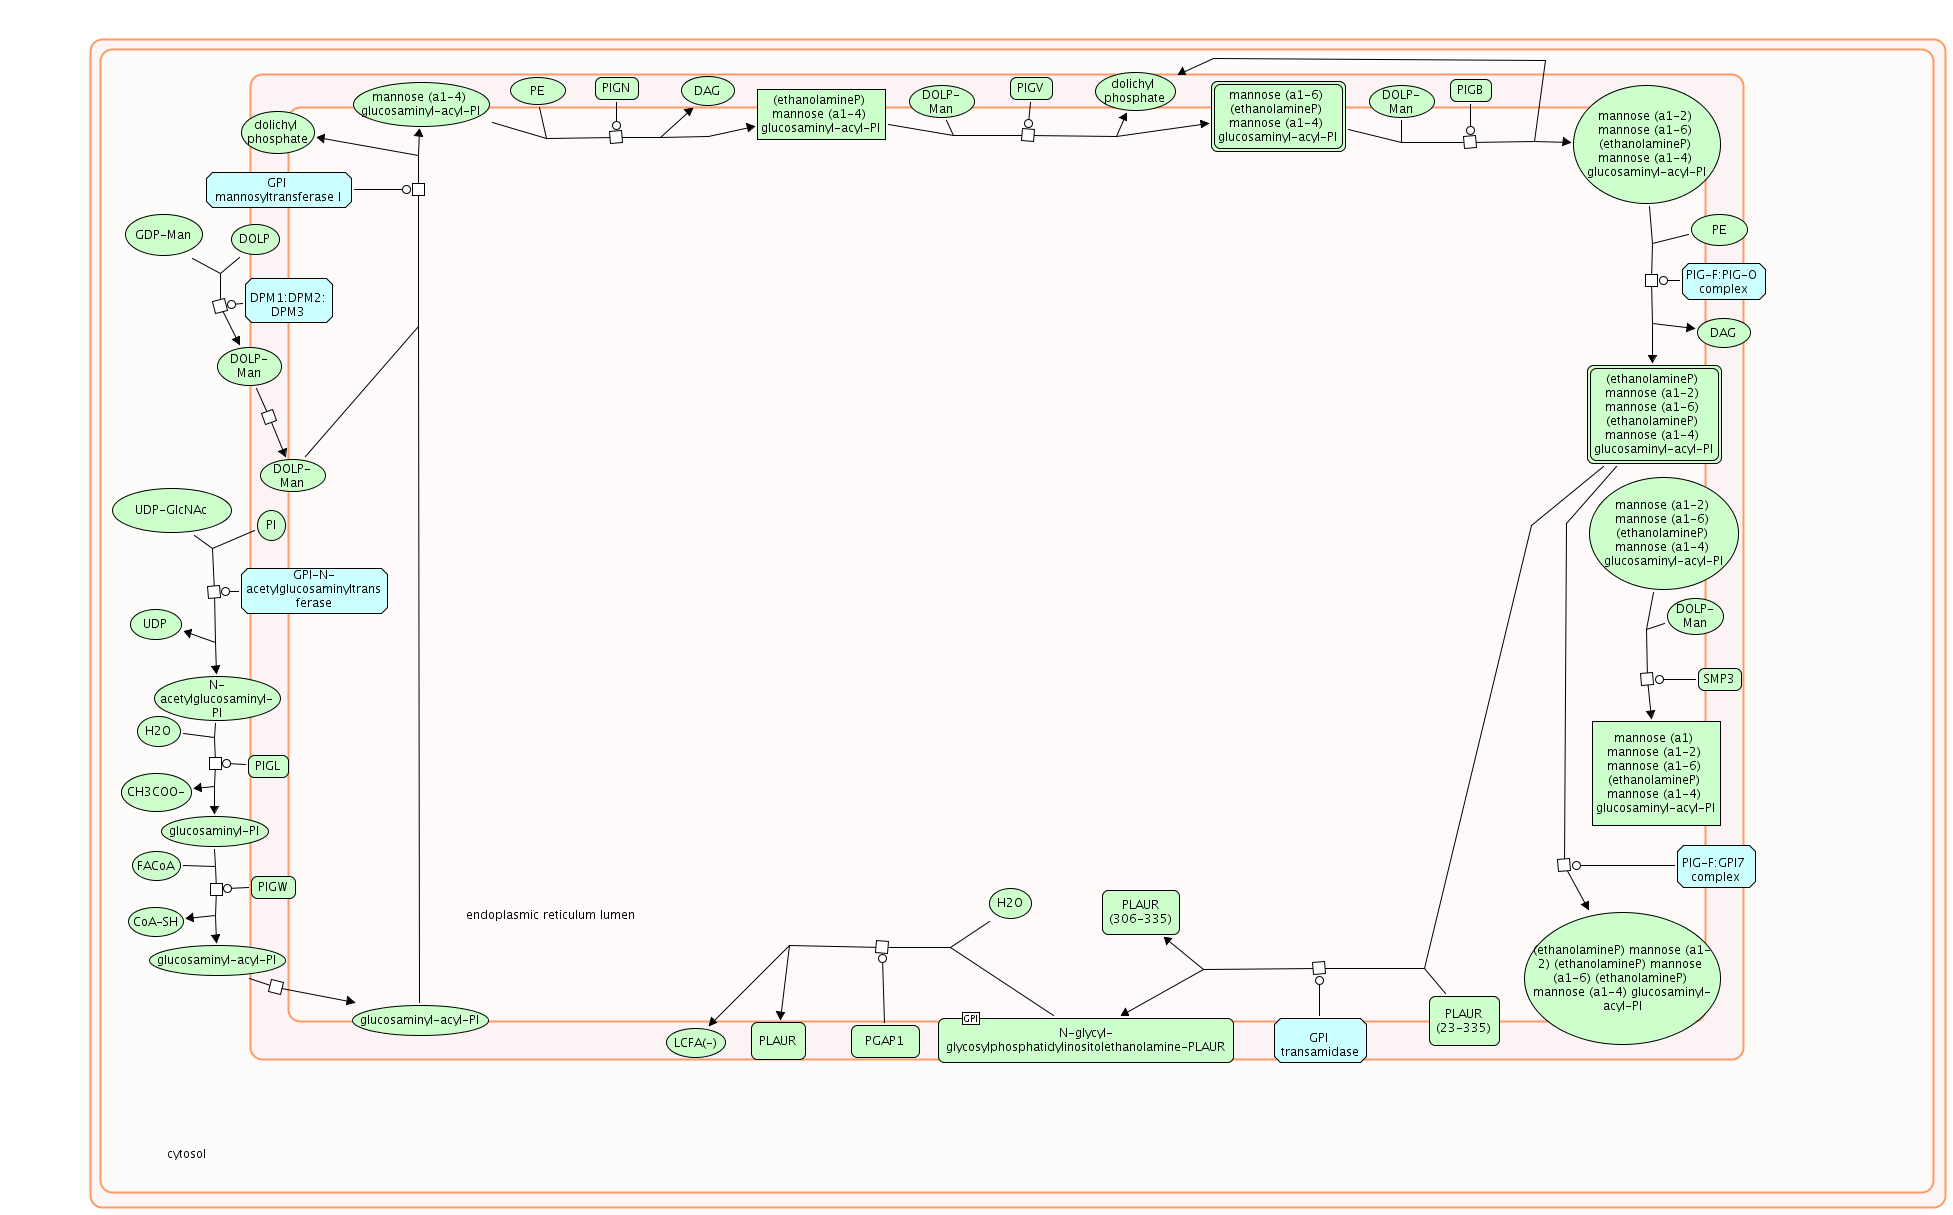
| Diagram of Post-translational modification_ synthesis of GPI-anchored proteins.png | 2025-05-14 16:55 | 155K | |
| Diagram of Positive epigenetic regulation of rRNA expression.png | 2025-05-14 16:59 | 10K | |
| Diagram of Platelet homeostasis.png | 2025-05-14 16:58 | 171K | |
| Diagram of Platelet activation.png | 2025-05-14 16:57 | 7.7K | |
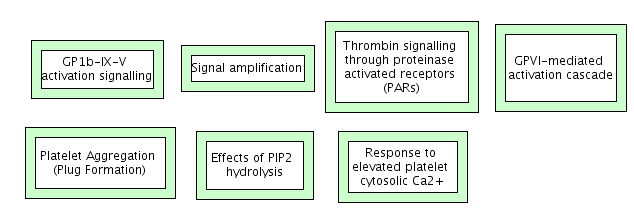
| Diagram of Platelet activation, signaling and aggregation.png | 2025-05-14 16:59 | 7.7K | |
| Diagram of Platelet Aggregation (Plug Formation).png | 2025-05-14 16:56 | 20K | |
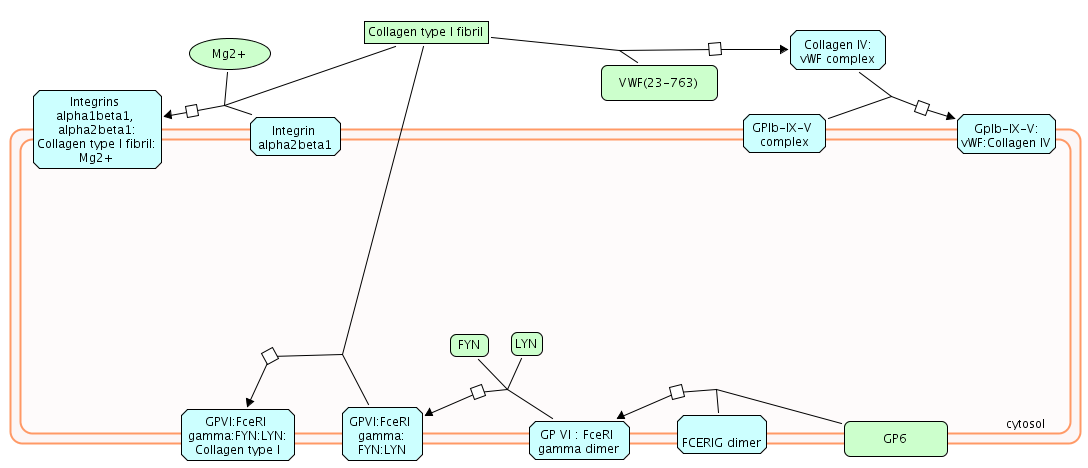
| Diagram of Platelet Adhesion to exposed collagen.png | 2025-05-14 16:58 | 34K | |
| Diagram of Phospholipid Pathways.png | 2025-05-14 16:57 | 2.3K | |
| Diagram of Phase II conjugation.png | 2025-05-14 16:56 | 767K | |
| Diagram of Phase II conjugation, Defective AHCY causes Hypermethioninemia with S-adenosylhomocysteine hydrolase deficiency (HMAHCHD), Defective GCLC causes Hemolytic anemia due to gamma-glutamylcysteine synthetase deficiency (HAGGSD), Defective GGT1 c.png | 2025-05-14 16:55 | 767K | |
| Diagram of Phase 1 - Functionalization of compounds.png | 2025-05-14 16:56 | 1.2M | |
| Diagram of Phase 1 - Functionalization of compounds, Defective CYP11A1 causes Adrenal insufficiency, congenital, with 46,XY sex reversal (AICSR), Defective CYP11B1 causes Adrenal hyperplasia 4 (AH4), Defective CYP11B2 causes Corticosterone methyloxida.png | 2025-05-14 17:00 | 1.2M | |
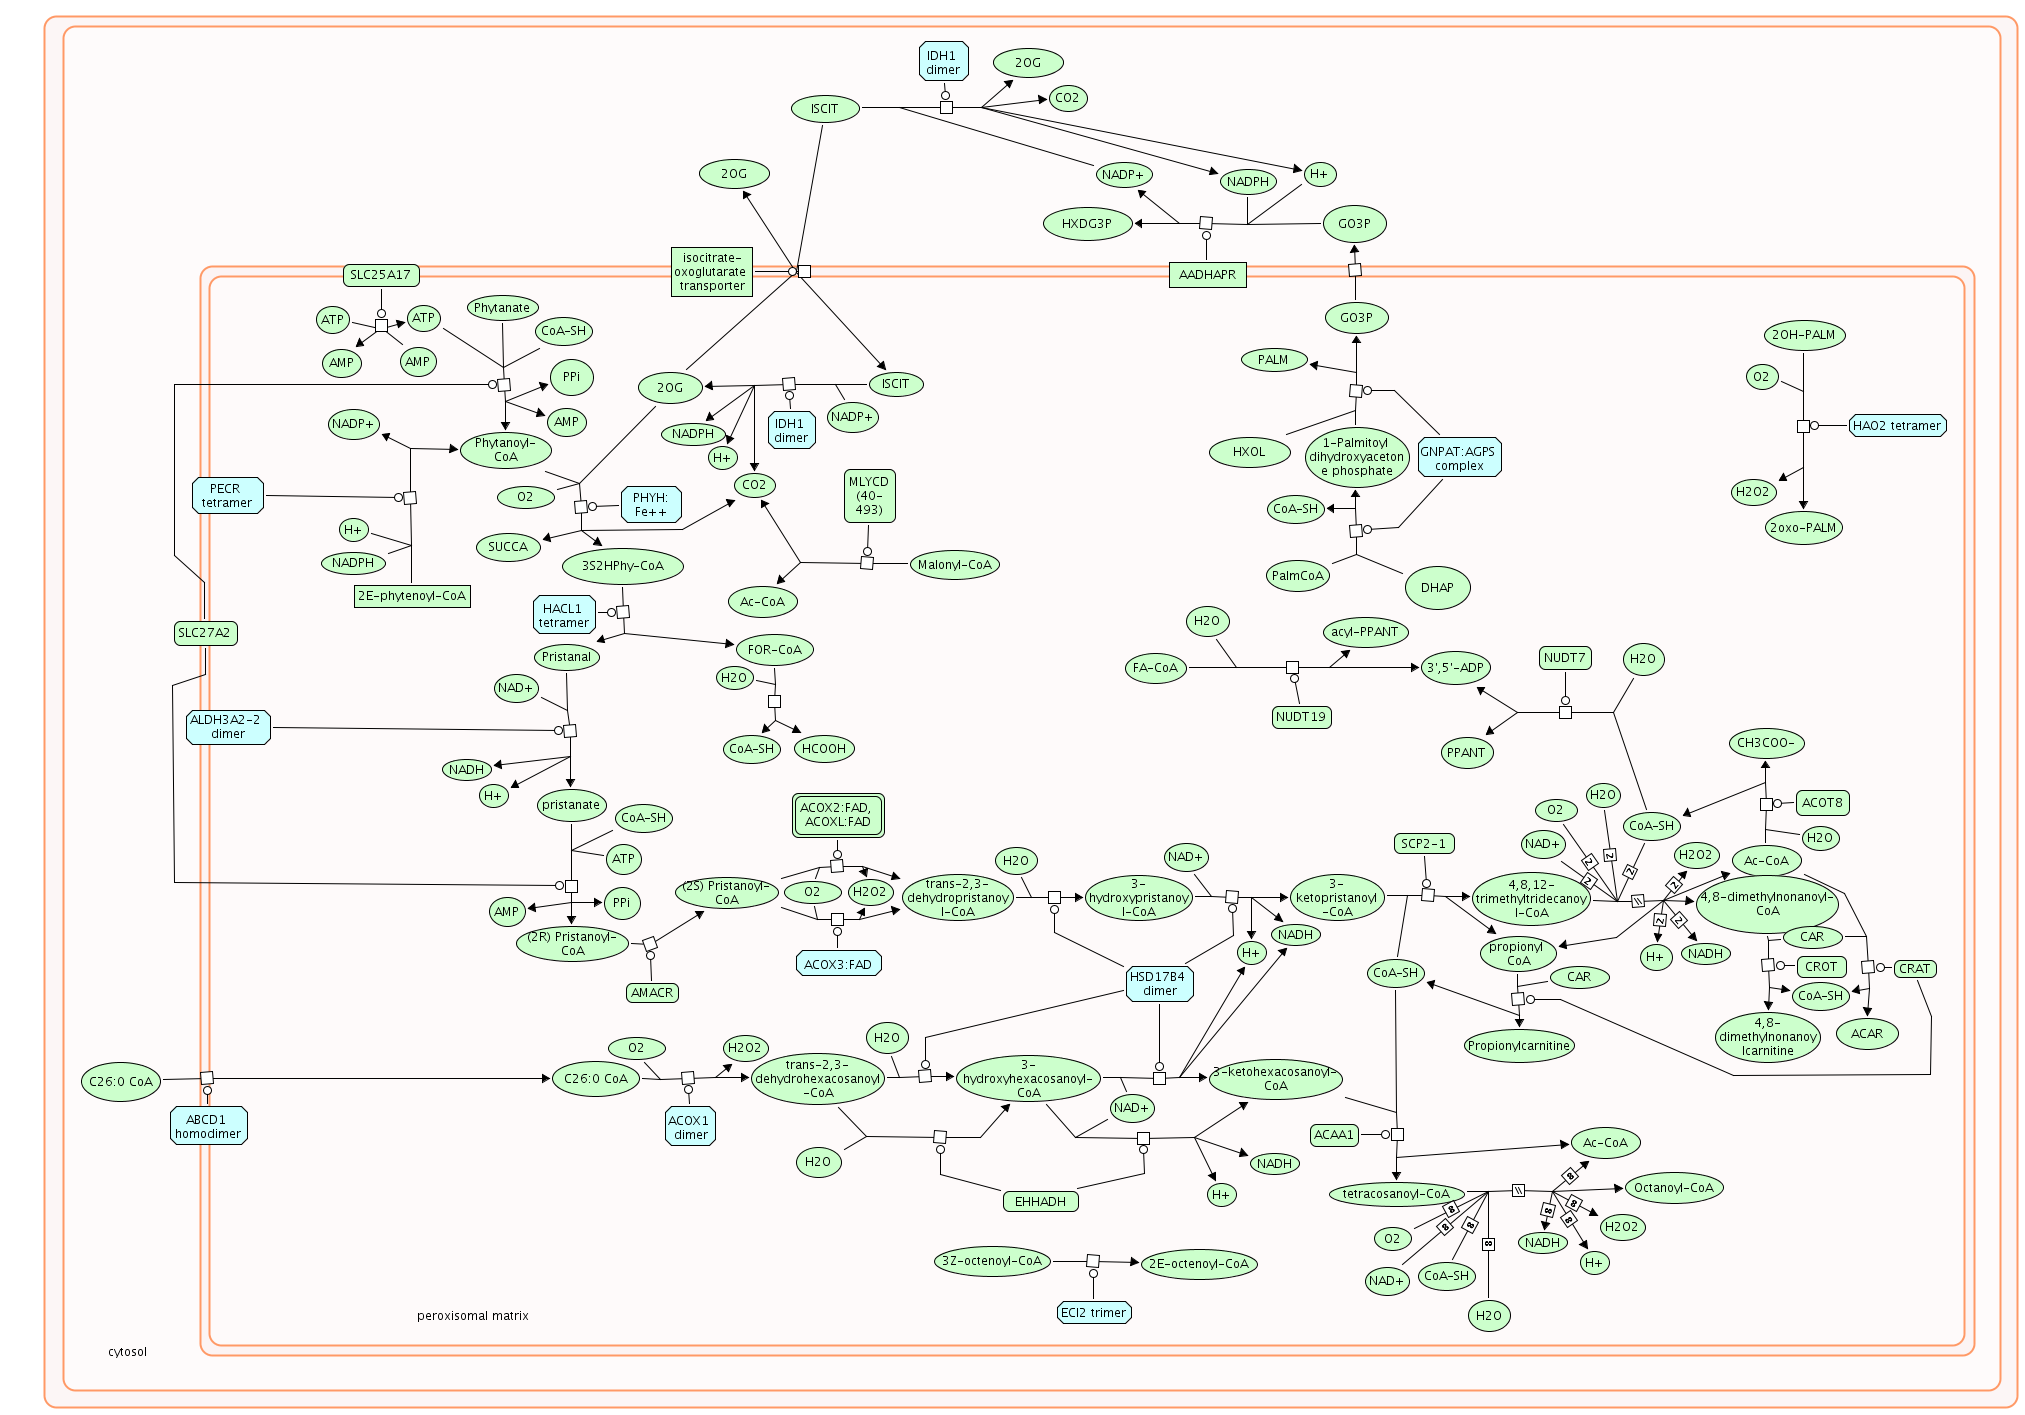
| Diagram of Peroxisomal lipid metabolism.png | 2025-05-14 16:58 | 297K | |
| Diagram of Peptide hormone metabolism.png | 2025-05-14 16:56 | 5.2K | |
| Diagram of Peptide hormone biosynthesis.png | 2025-05-14 16:56 | 38K | |
| Diagram of Pentose phosphate pathway disease.png | 2025-05-14 16:57 | 8.6K | |
| Diagram of Passive transport by Aquaporins.png | 2025-05-14 16:57 | 38K | |
| Diagram of Paradoxical activation of RAF signaling by kinase inactive BRAF.png | 2025-05-14 17:00 | 513K | |
| Diagram of PTEN Loss of Function in Cancer.png | 2025-05-14 17:00 | 360K | |
| Diagram of POU5F1 (OCT4).png | 2025-05-14 16:57 | 100K | |
| Diagram of POU5F1 (OCT4), SOX2, NANOG repress genes related to differentiation.png | 2025-05-14 17:00 | 100K | |
| Diagram of POU5F1 (OCT4), SOX2, NANOG activate genes related to proliferation.png | 2025-05-14 16:55 | 176K | |
| Diagram of PIP3 activates AKT signaling.png | 2025-05-14 17:00 | 360K | |
| Diagram of PIP3 activates AKT signaling, Constitutive Signaling by Aberrant PI3K in Cancer, Constitutive Signaling by AKT1 E17K in Cancer, and PTEN Loss of Function in Cancer.png | 2025-05-14 16:57 | 360K | |
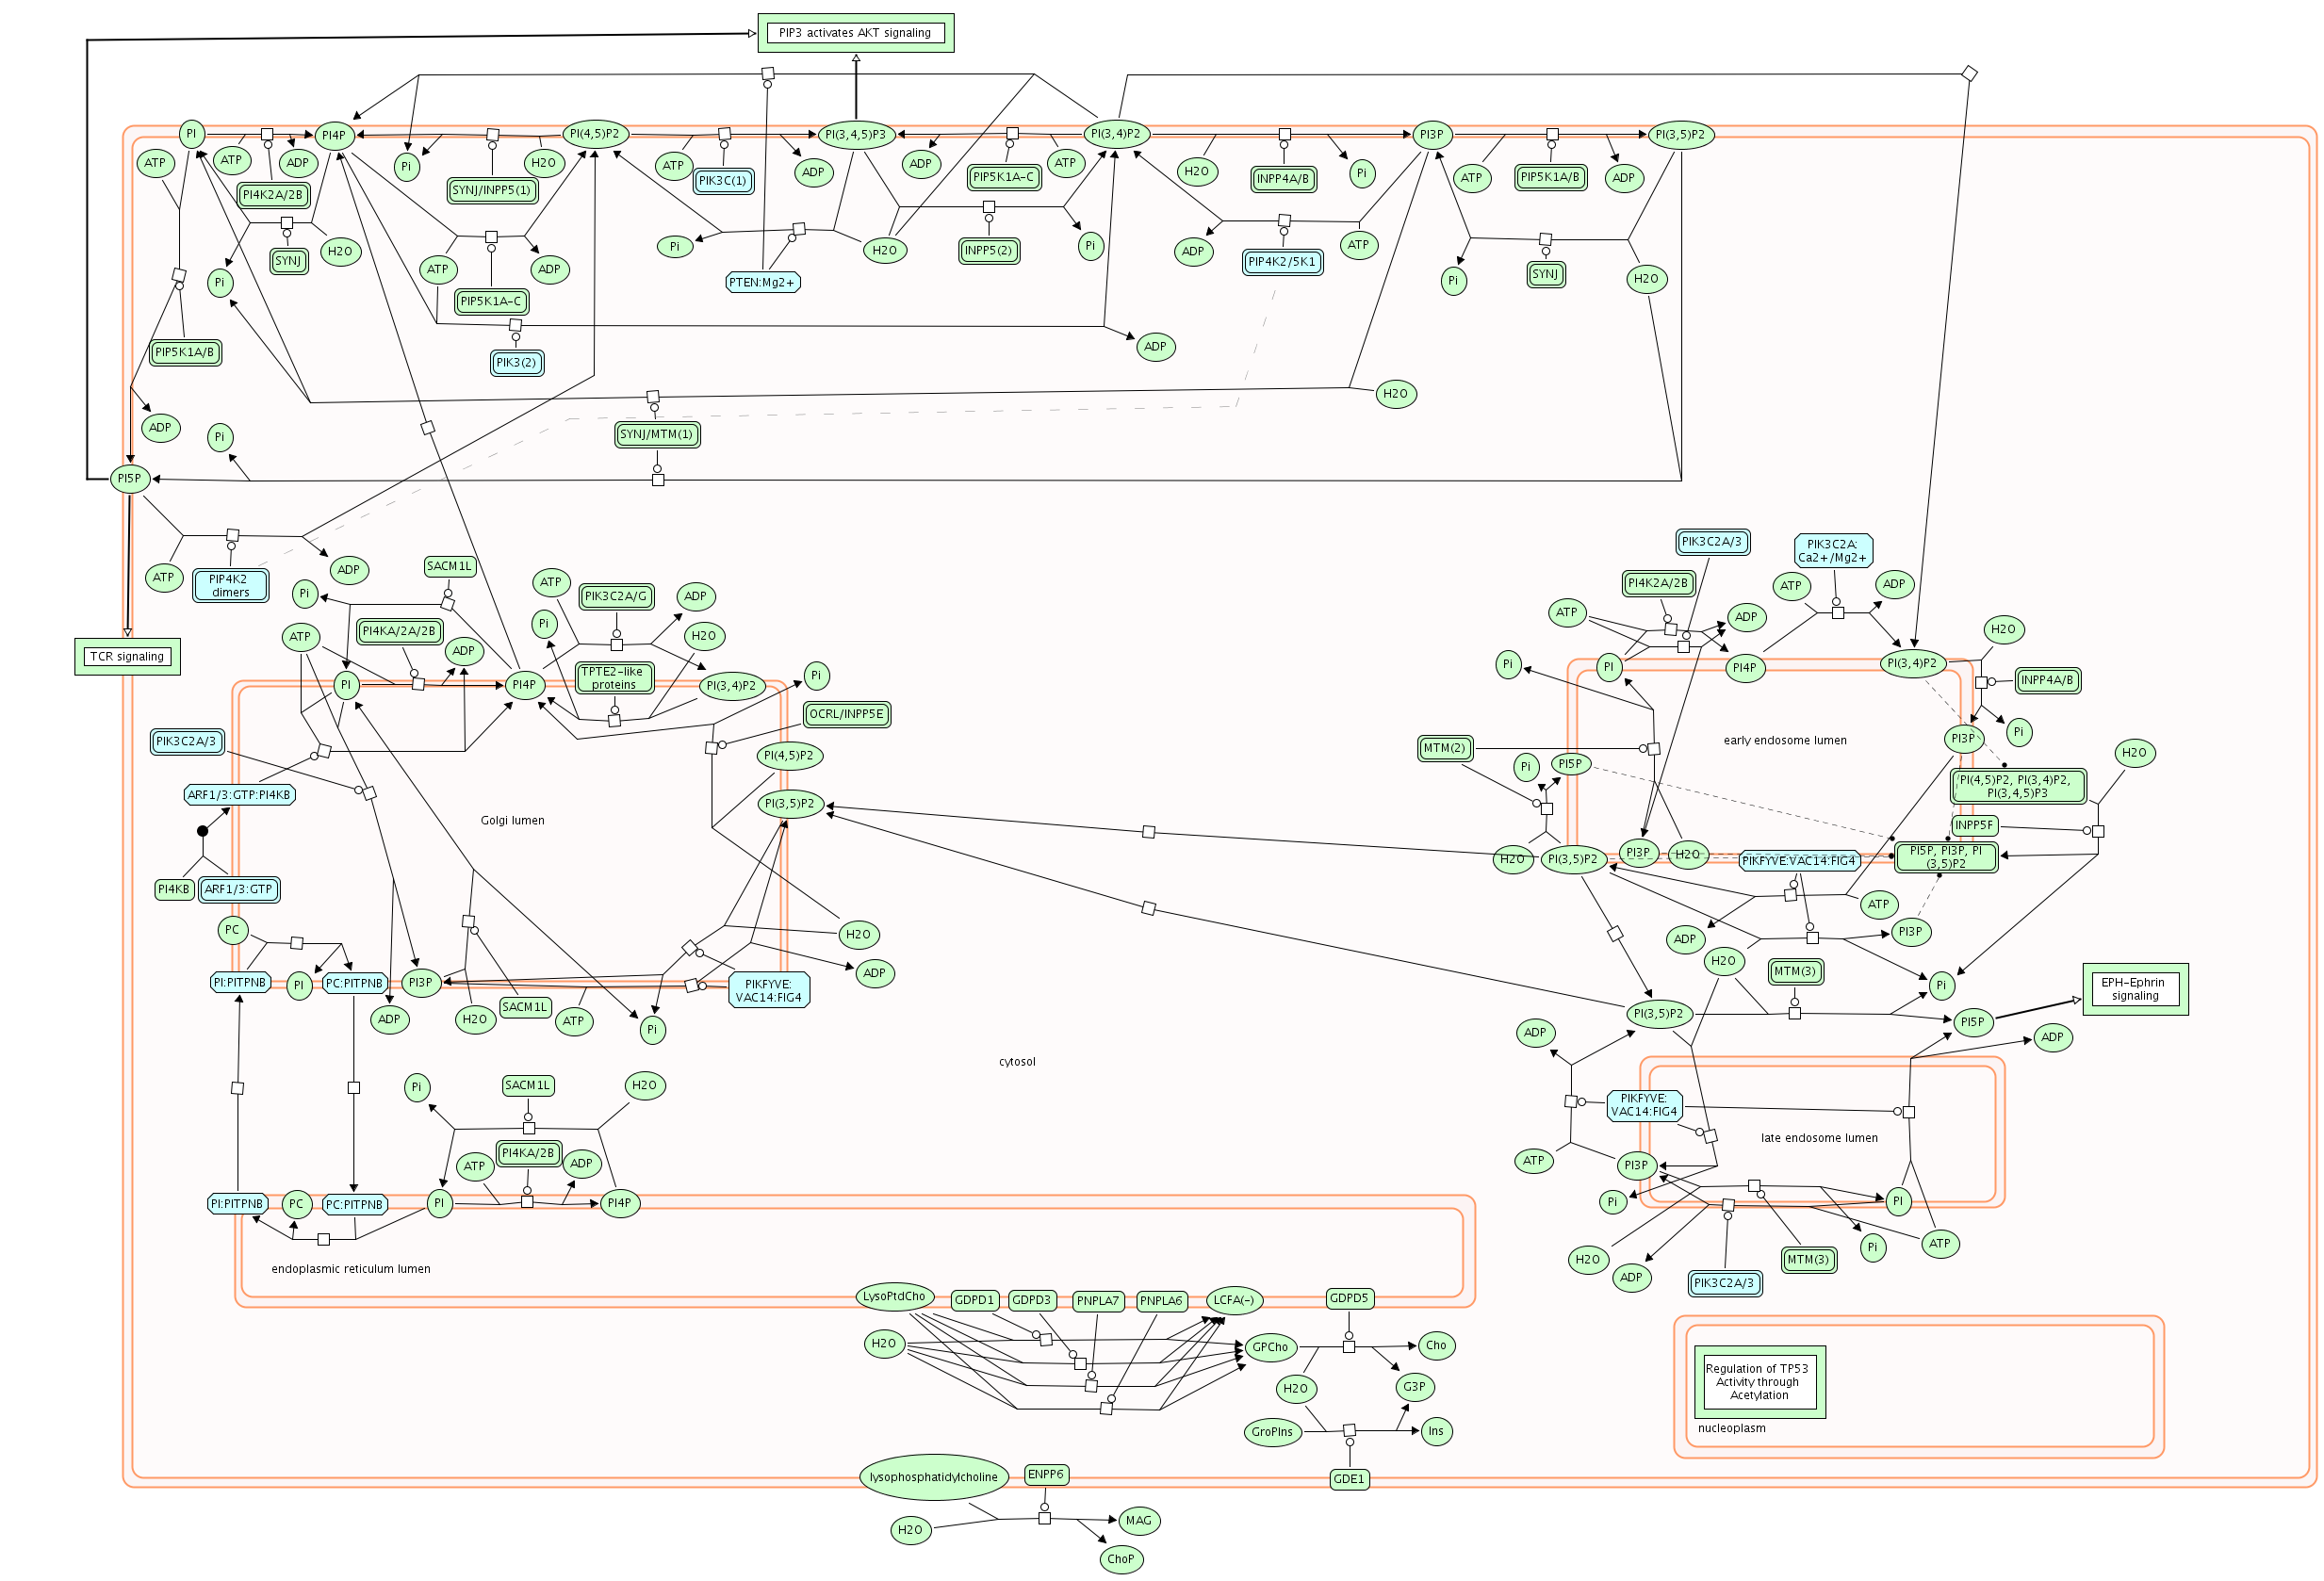
| Diagram of PI Metabolism.png | 2025-05-14 16:59 | 415K | |
| Diagram of PI3K-AKT Signaling in Cancer.png | 2025-05-14 16:56 | 4.9K | |
| Diagram of Oxidative Stress Induced Senescence.png | 2025-05-14 16:56 | 226K | |
| Diagram of Organelle biogenesis and maintenance.png | 2025-05-14 16:59 | 3.5K | |
| Diagram of Opioid Signalling.png | 2025-05-14 16:57 | 293K | |
| Diagram of Oncogene Induced Senescence.png | 2025-05-14 16:57 | 95K | |
| Diagram of O2-CO2 exchange in erythrocytes.png | 2025-05-14 17:00 | 2.5K | |
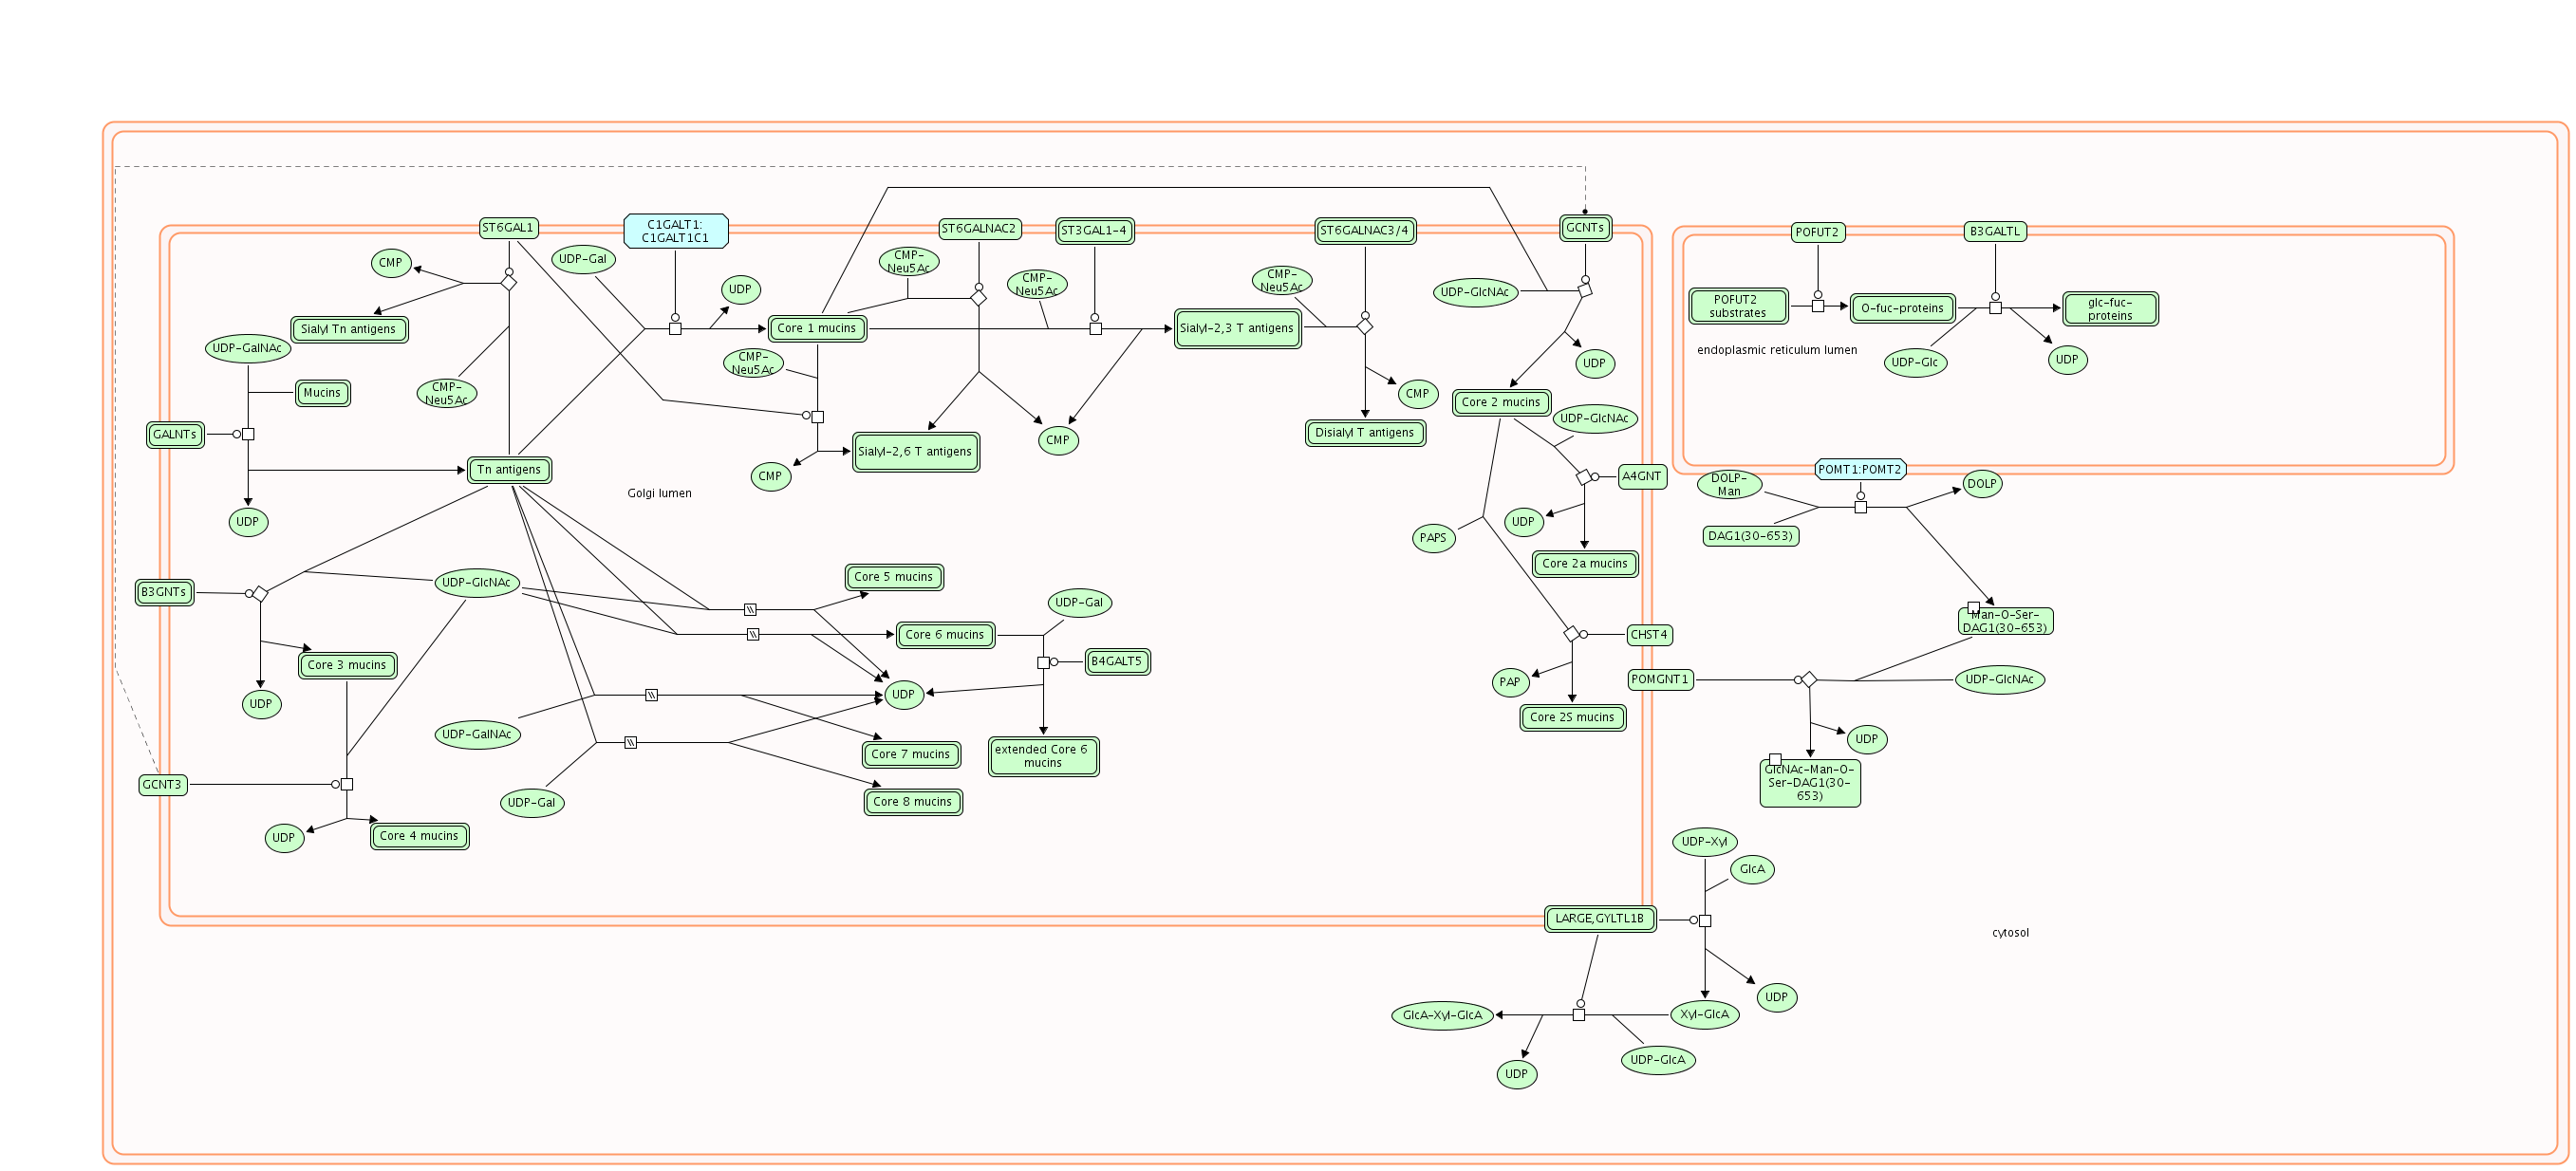
| Diagram of O-linked glycosylation.png | 2025-05-14 16:55 | 178K | |
| Diagram of O-linked glycosylation, Defective C1GALT1C1 causes Tn polyagglutination syndrome (TNPS), Defective GALNT3 causes familial hyperphosphatemic tumoral calcinosis (HFTC), Defective GALNT12 causes colorectal cancer 1 (CRCS1), Defective B3GALTL c.png | 2025-05-14 17:00 | 178K | |
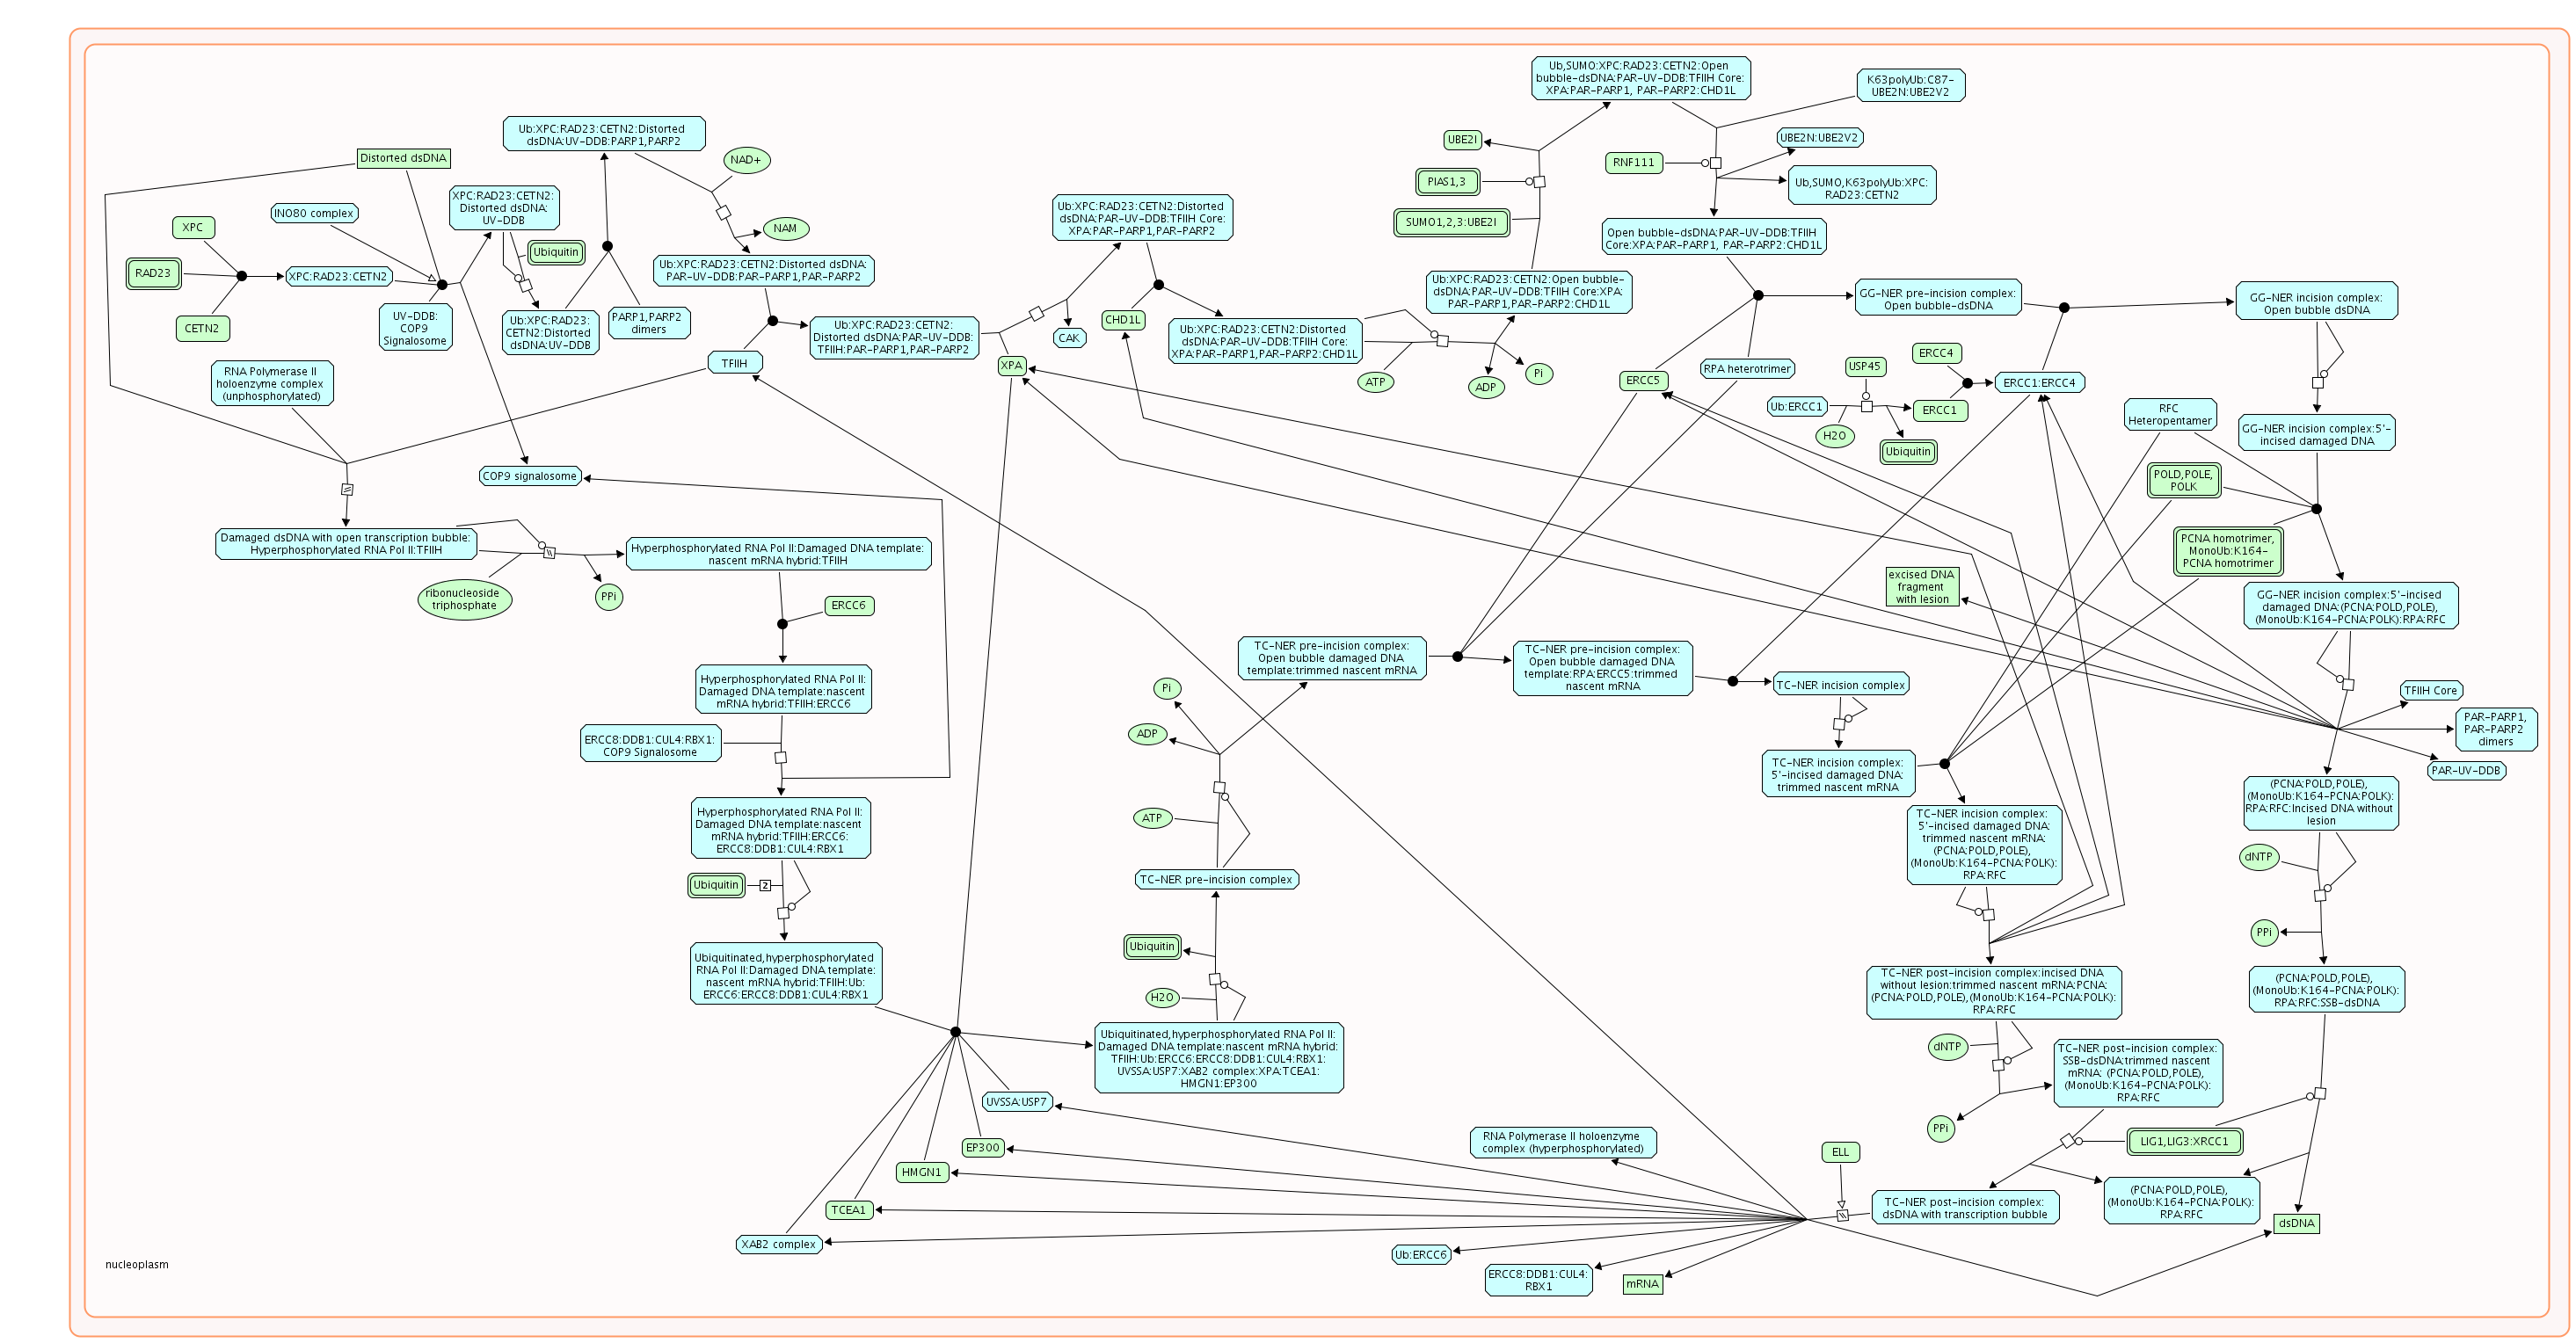
| Diagram of Nucleotide Excision Repair.png | 2025-05-14 17:00 | 424K | |
| Diagram of Nucleotide-binding domain.png | 2025-05-14 16:56 | 189K | |
| Diagram of Nucleotide-binding domain, leucine rich repeat containing receptor (NLR) signaling pathways.png | 2025-05-14 17:00 | 189K | |
| Diagram of Nucleosome assembly.png | 2025-05-14 16:56 | 27K | |
| Diagram of Nonsense-Mediated Decay (NMD).png | 2025-05-14 16:59 | 95K | |
| Diagram of Nonhomologous End-Joining (NHEJ).png | 2025-05-14 16:58 | 193K | |
| Diagram of Nonaka myopathy inclusion body myopathy 2.png | 2025-05-14 16:56 | 142K | |
| Diagram of Neurotransmitter uptake and Metabolism In Glial Cells.png | 2025-05-14 16:58 | 33K | |
| Diagram of Neurotransmitter Release Cycle and Defective SLC5A7 causes distal hereditary motor neuronopathy 7A (HMN7A).png | 2025-05-14 16:58 | 442K | |
| Diagram of Neurotransmitter Clearance In The Synaptic Cleft and Defective SLC6A3 causes Parkinsonism-dystonia infantile (PKDYS).png | 2025-05-14 16:59 | 122K | |
| Diagram of Neurotoxicity of clostridium toxins.png | 2025-05-14 16:57 | 236K | |
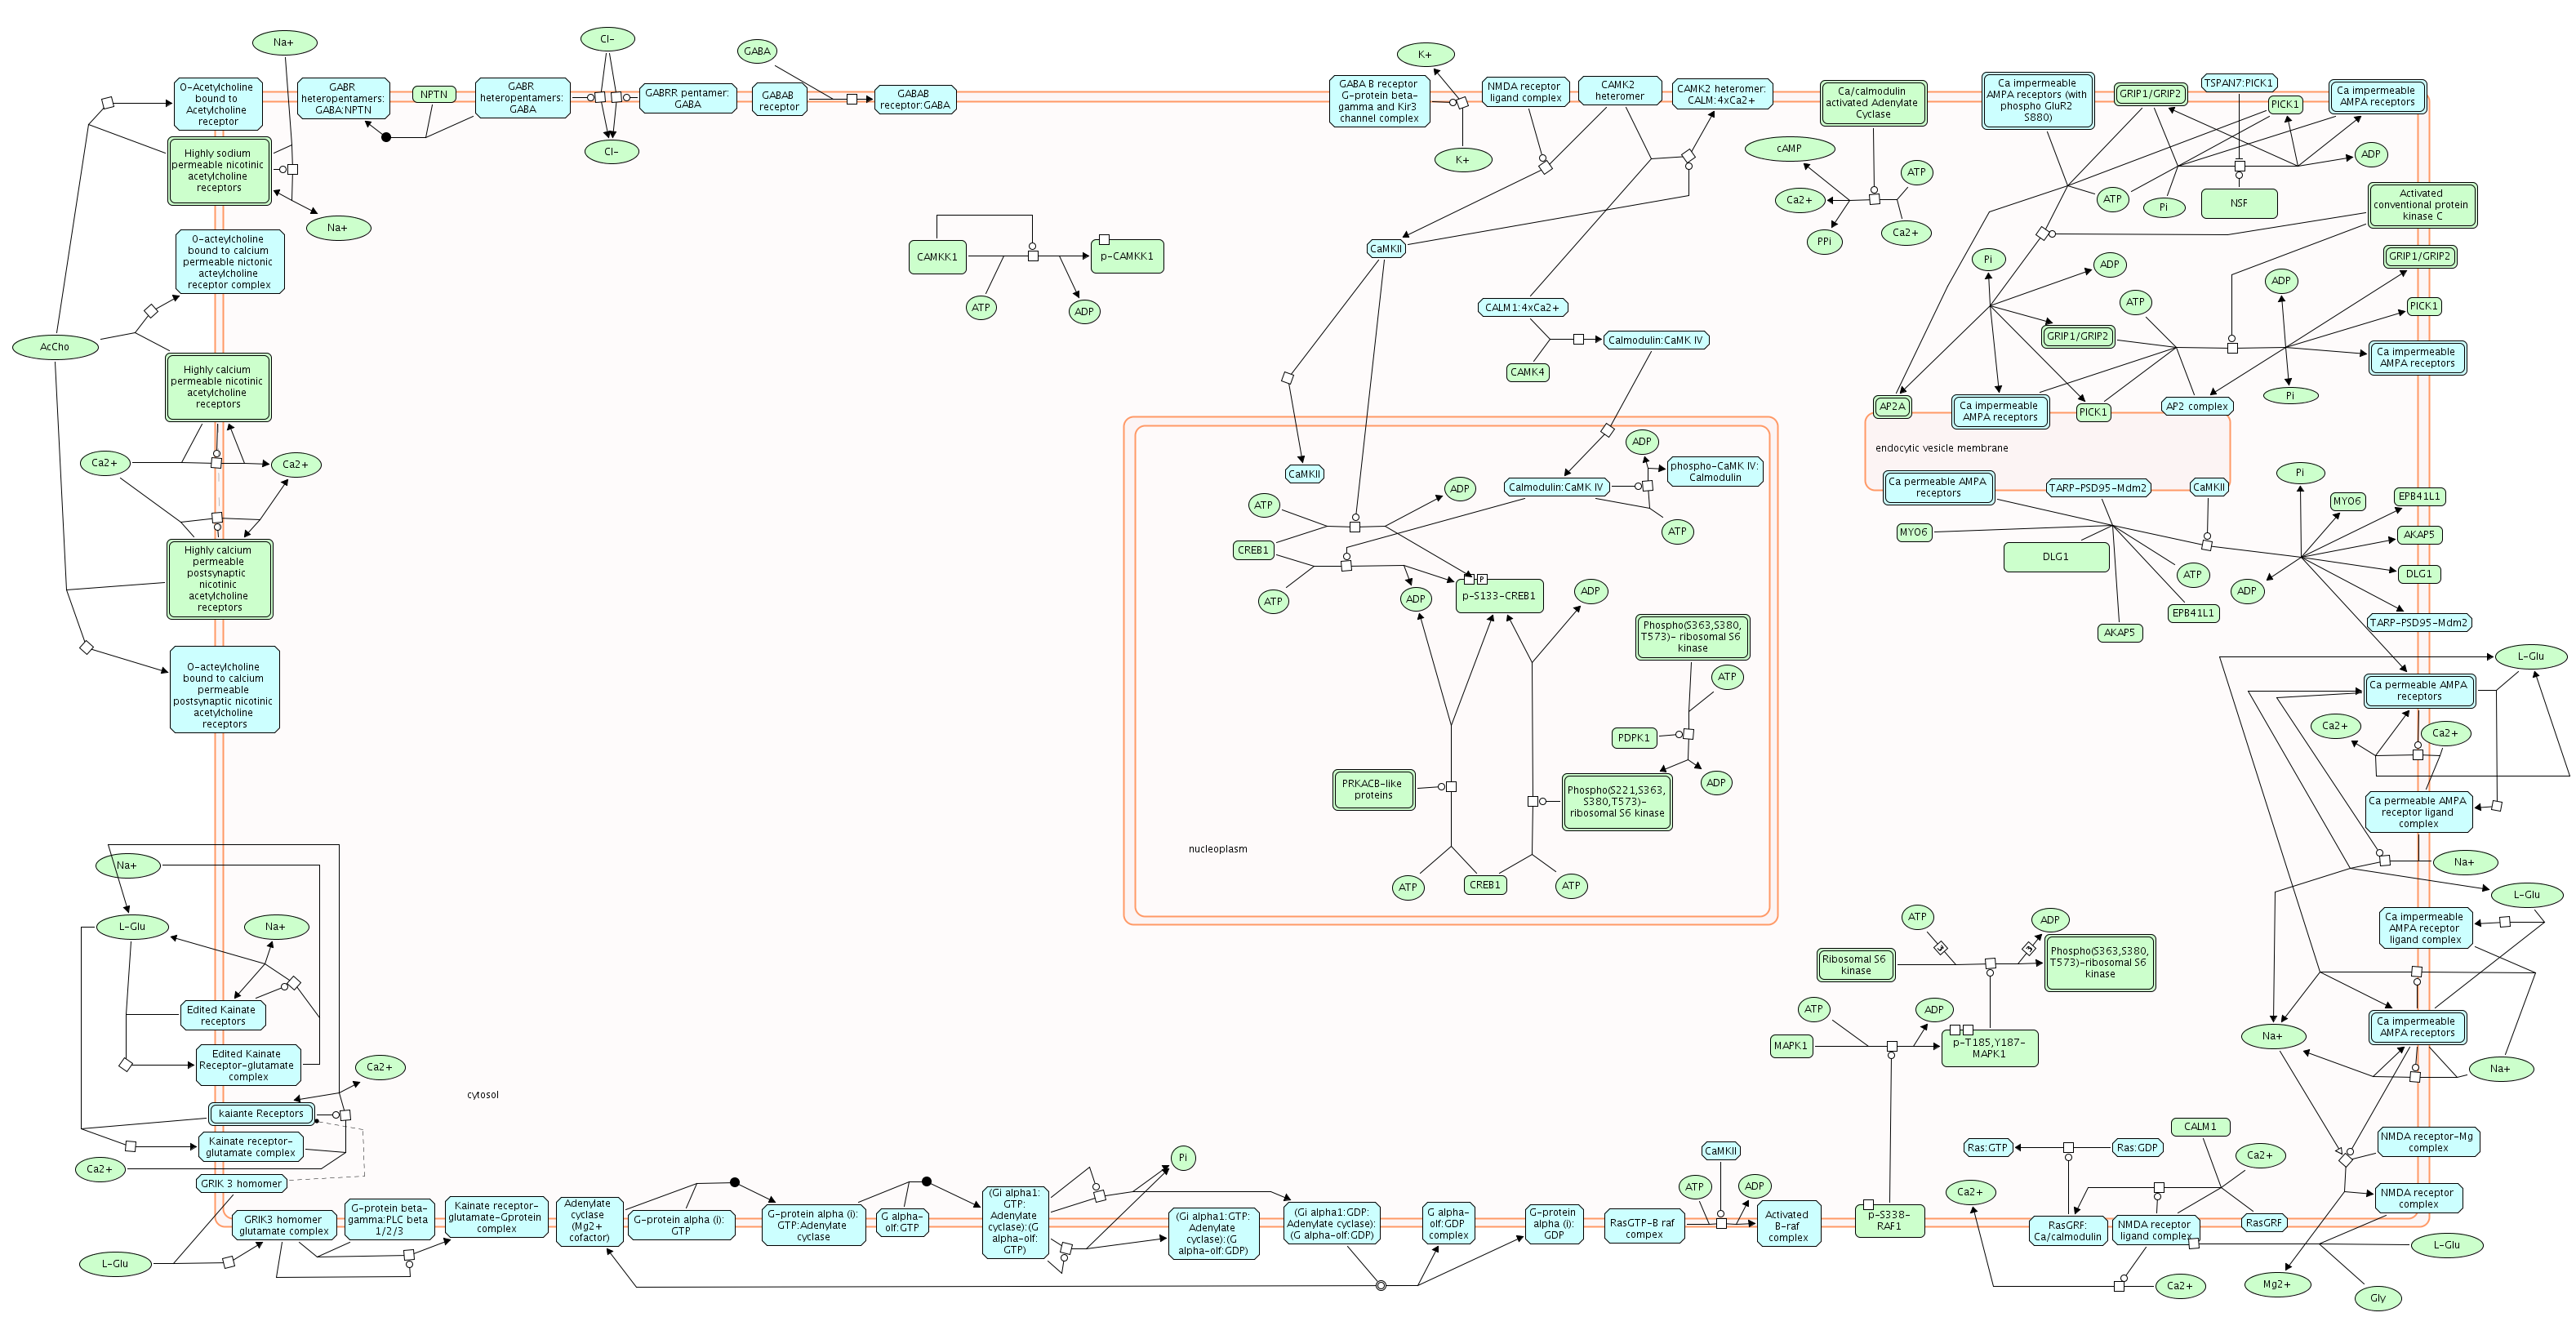
| Diagram of Neuroransmitter Receptor Binding And Downstream Transmission In The Postsynaptic Cell.png | 2025-05-14 16:56 | 421K | |
| Diagram of Netrin-1 signaling.png | 2025-05-14 17:00 | 148K | |
| Diagram of Nephrin interactions.png | 2025-05-14 16:58 | 54K | |
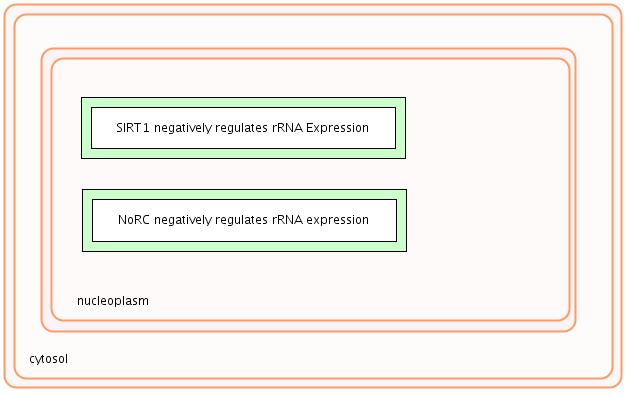
| Diagram of Negative epigenetic regulation of rRNA expression.png | 2025-05-14 17:00 | 8.7K | |
| Diagram of NR1D1 (REV-ERBA) represses gene expression.png | 2025-05-14 16:56 | 81K | |
| Diagram of NIK--_noncanonical NF-kB signaling.png | 2025-05-14 16:59 | 50K | |
| Diagram of NCAM signaling for neurite out-growth.png | 2025-05-14 16:57 | 121K | |
| Diagram of NANOG repress genes related to differentiation.png | 2025-05-14 17:00 | 100K | |
| Diagram of NANOG activate genes related to proliferation.png | 2025-05-14 16:56 | 176K | |
| Diagram of Myogenesis.png | 2025-05-14 16:55 | 68K | |
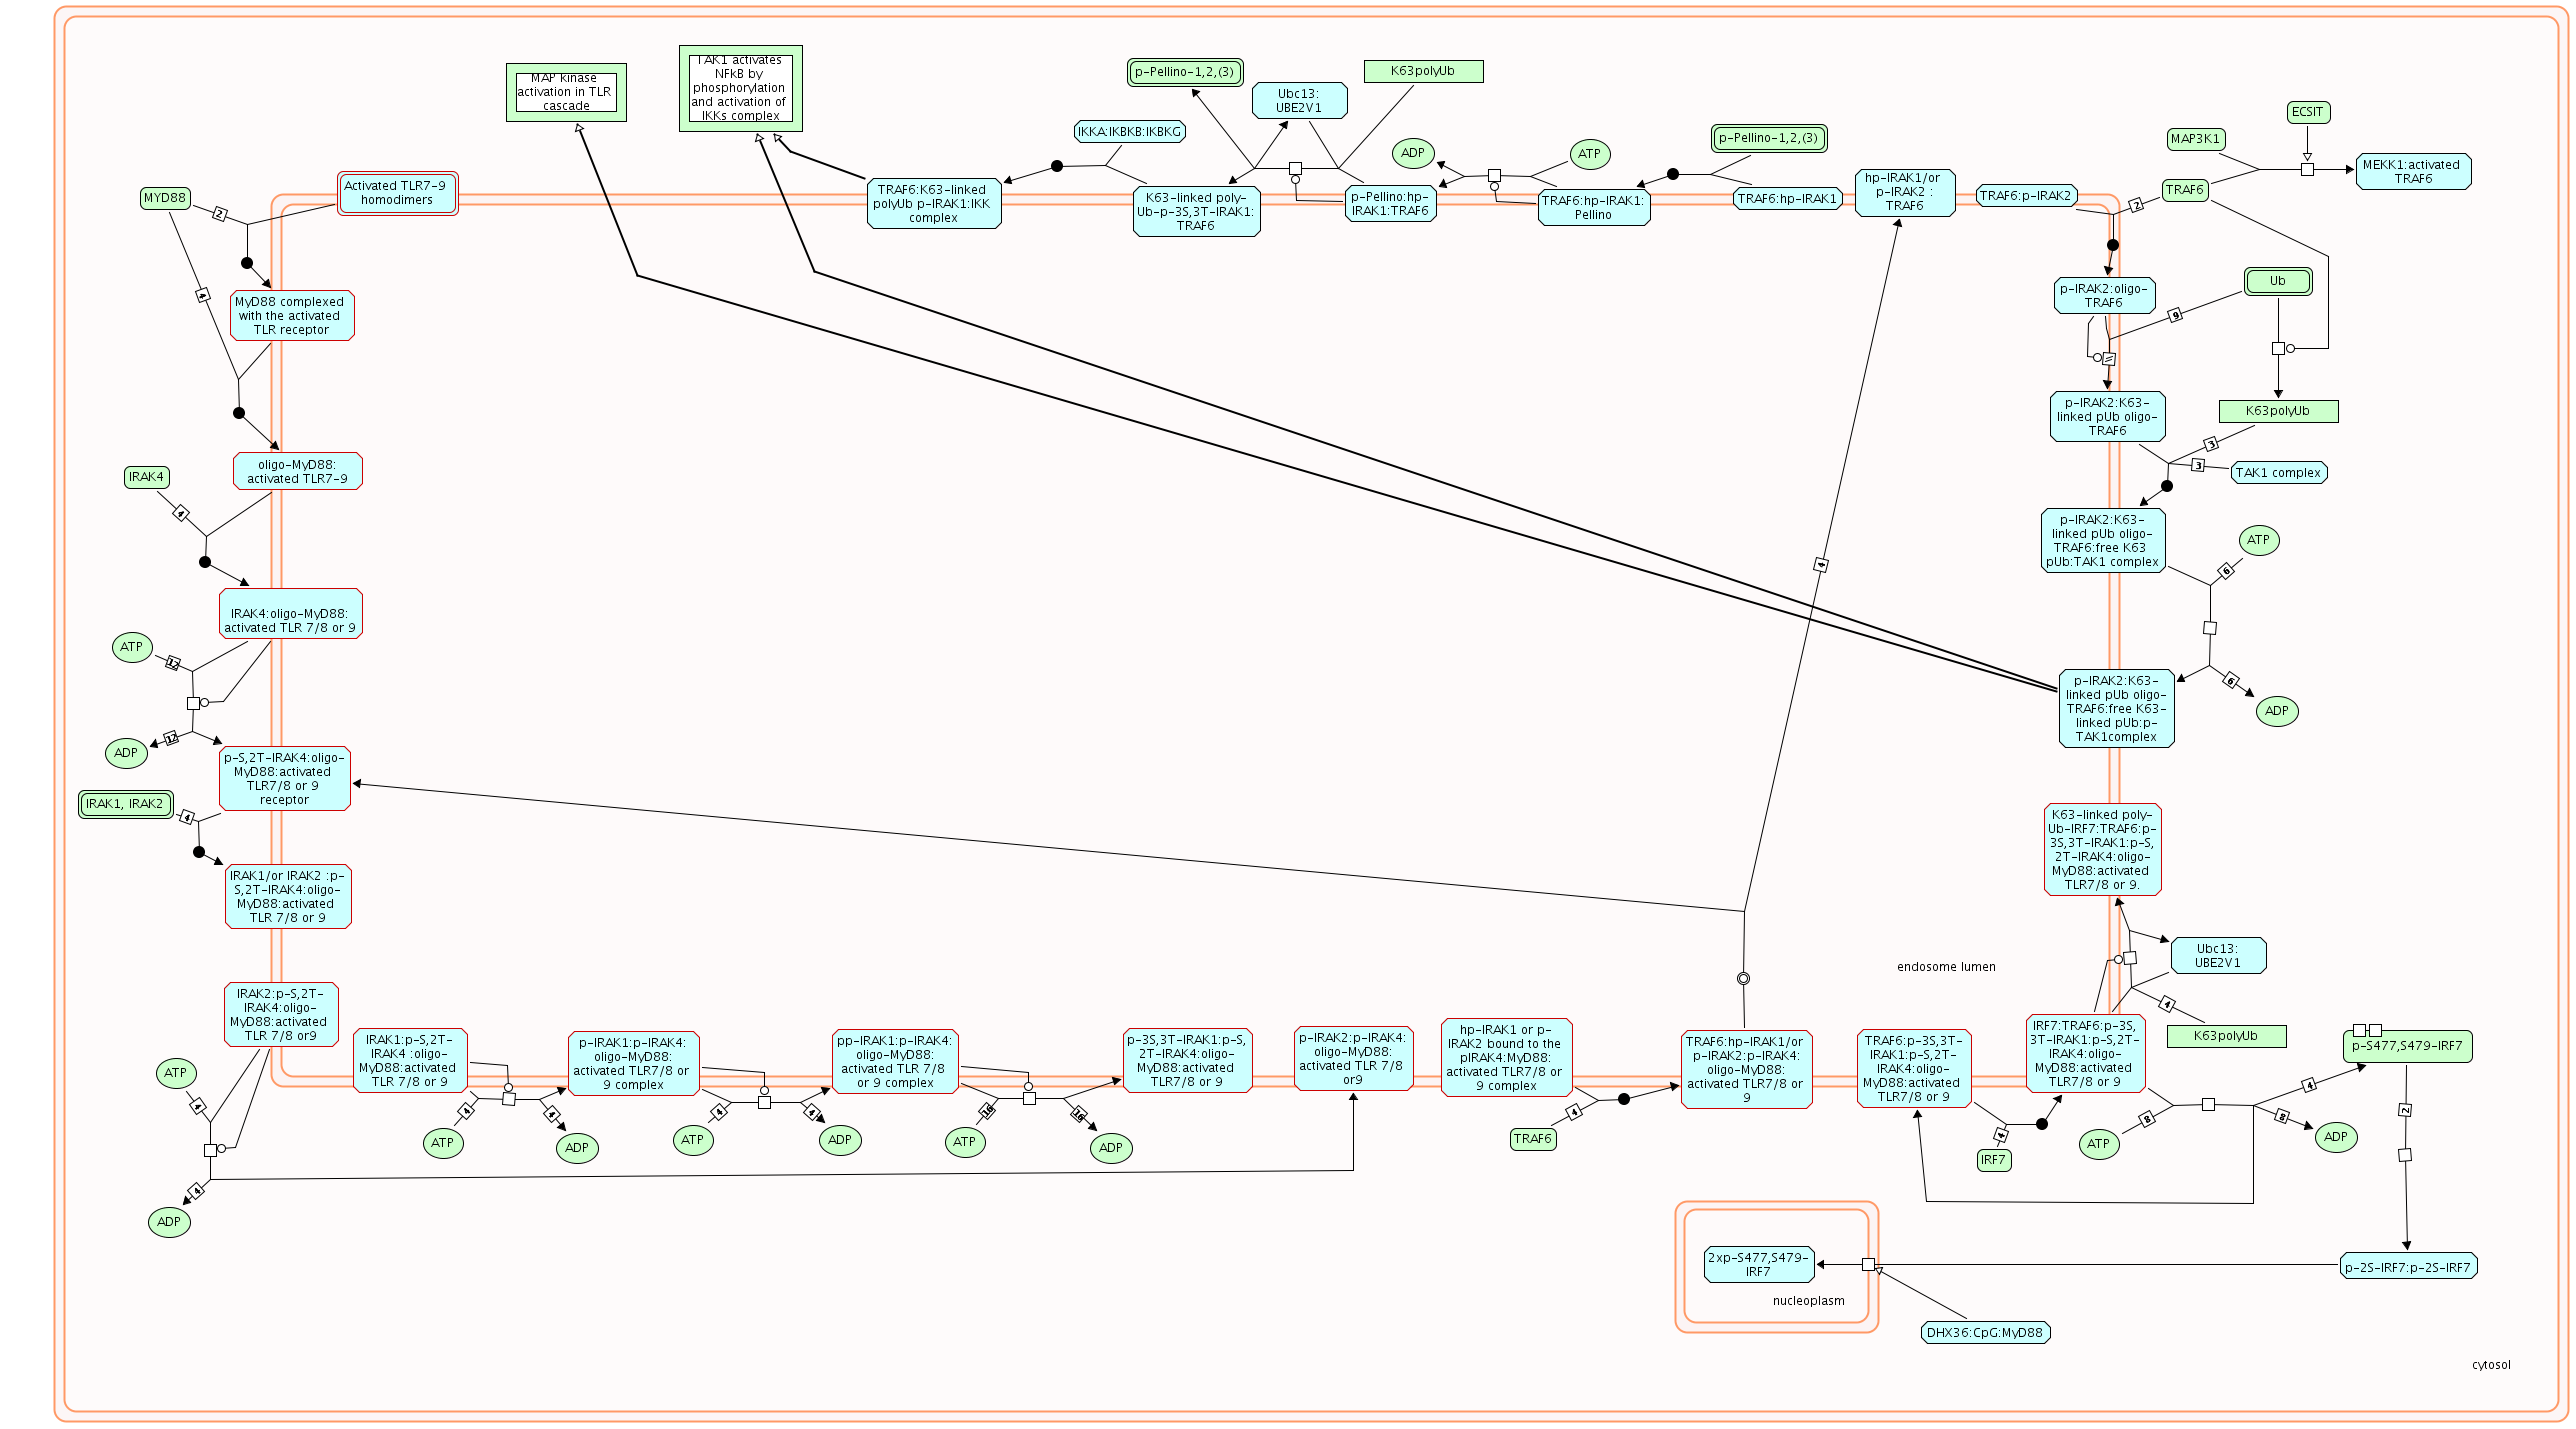
| Diagram of MyD88 dependent cascade initiated on endosome.png | 2025-05-14 16:59 | 223K | |
| Diagram of MyD88 deficiency (TLR5).png | 2025-05-14 16:55 | 179K | |
| Diagram of MyD88 deficiency (TLR2-4).png | 2025-05-14 16:58 | 146K | |
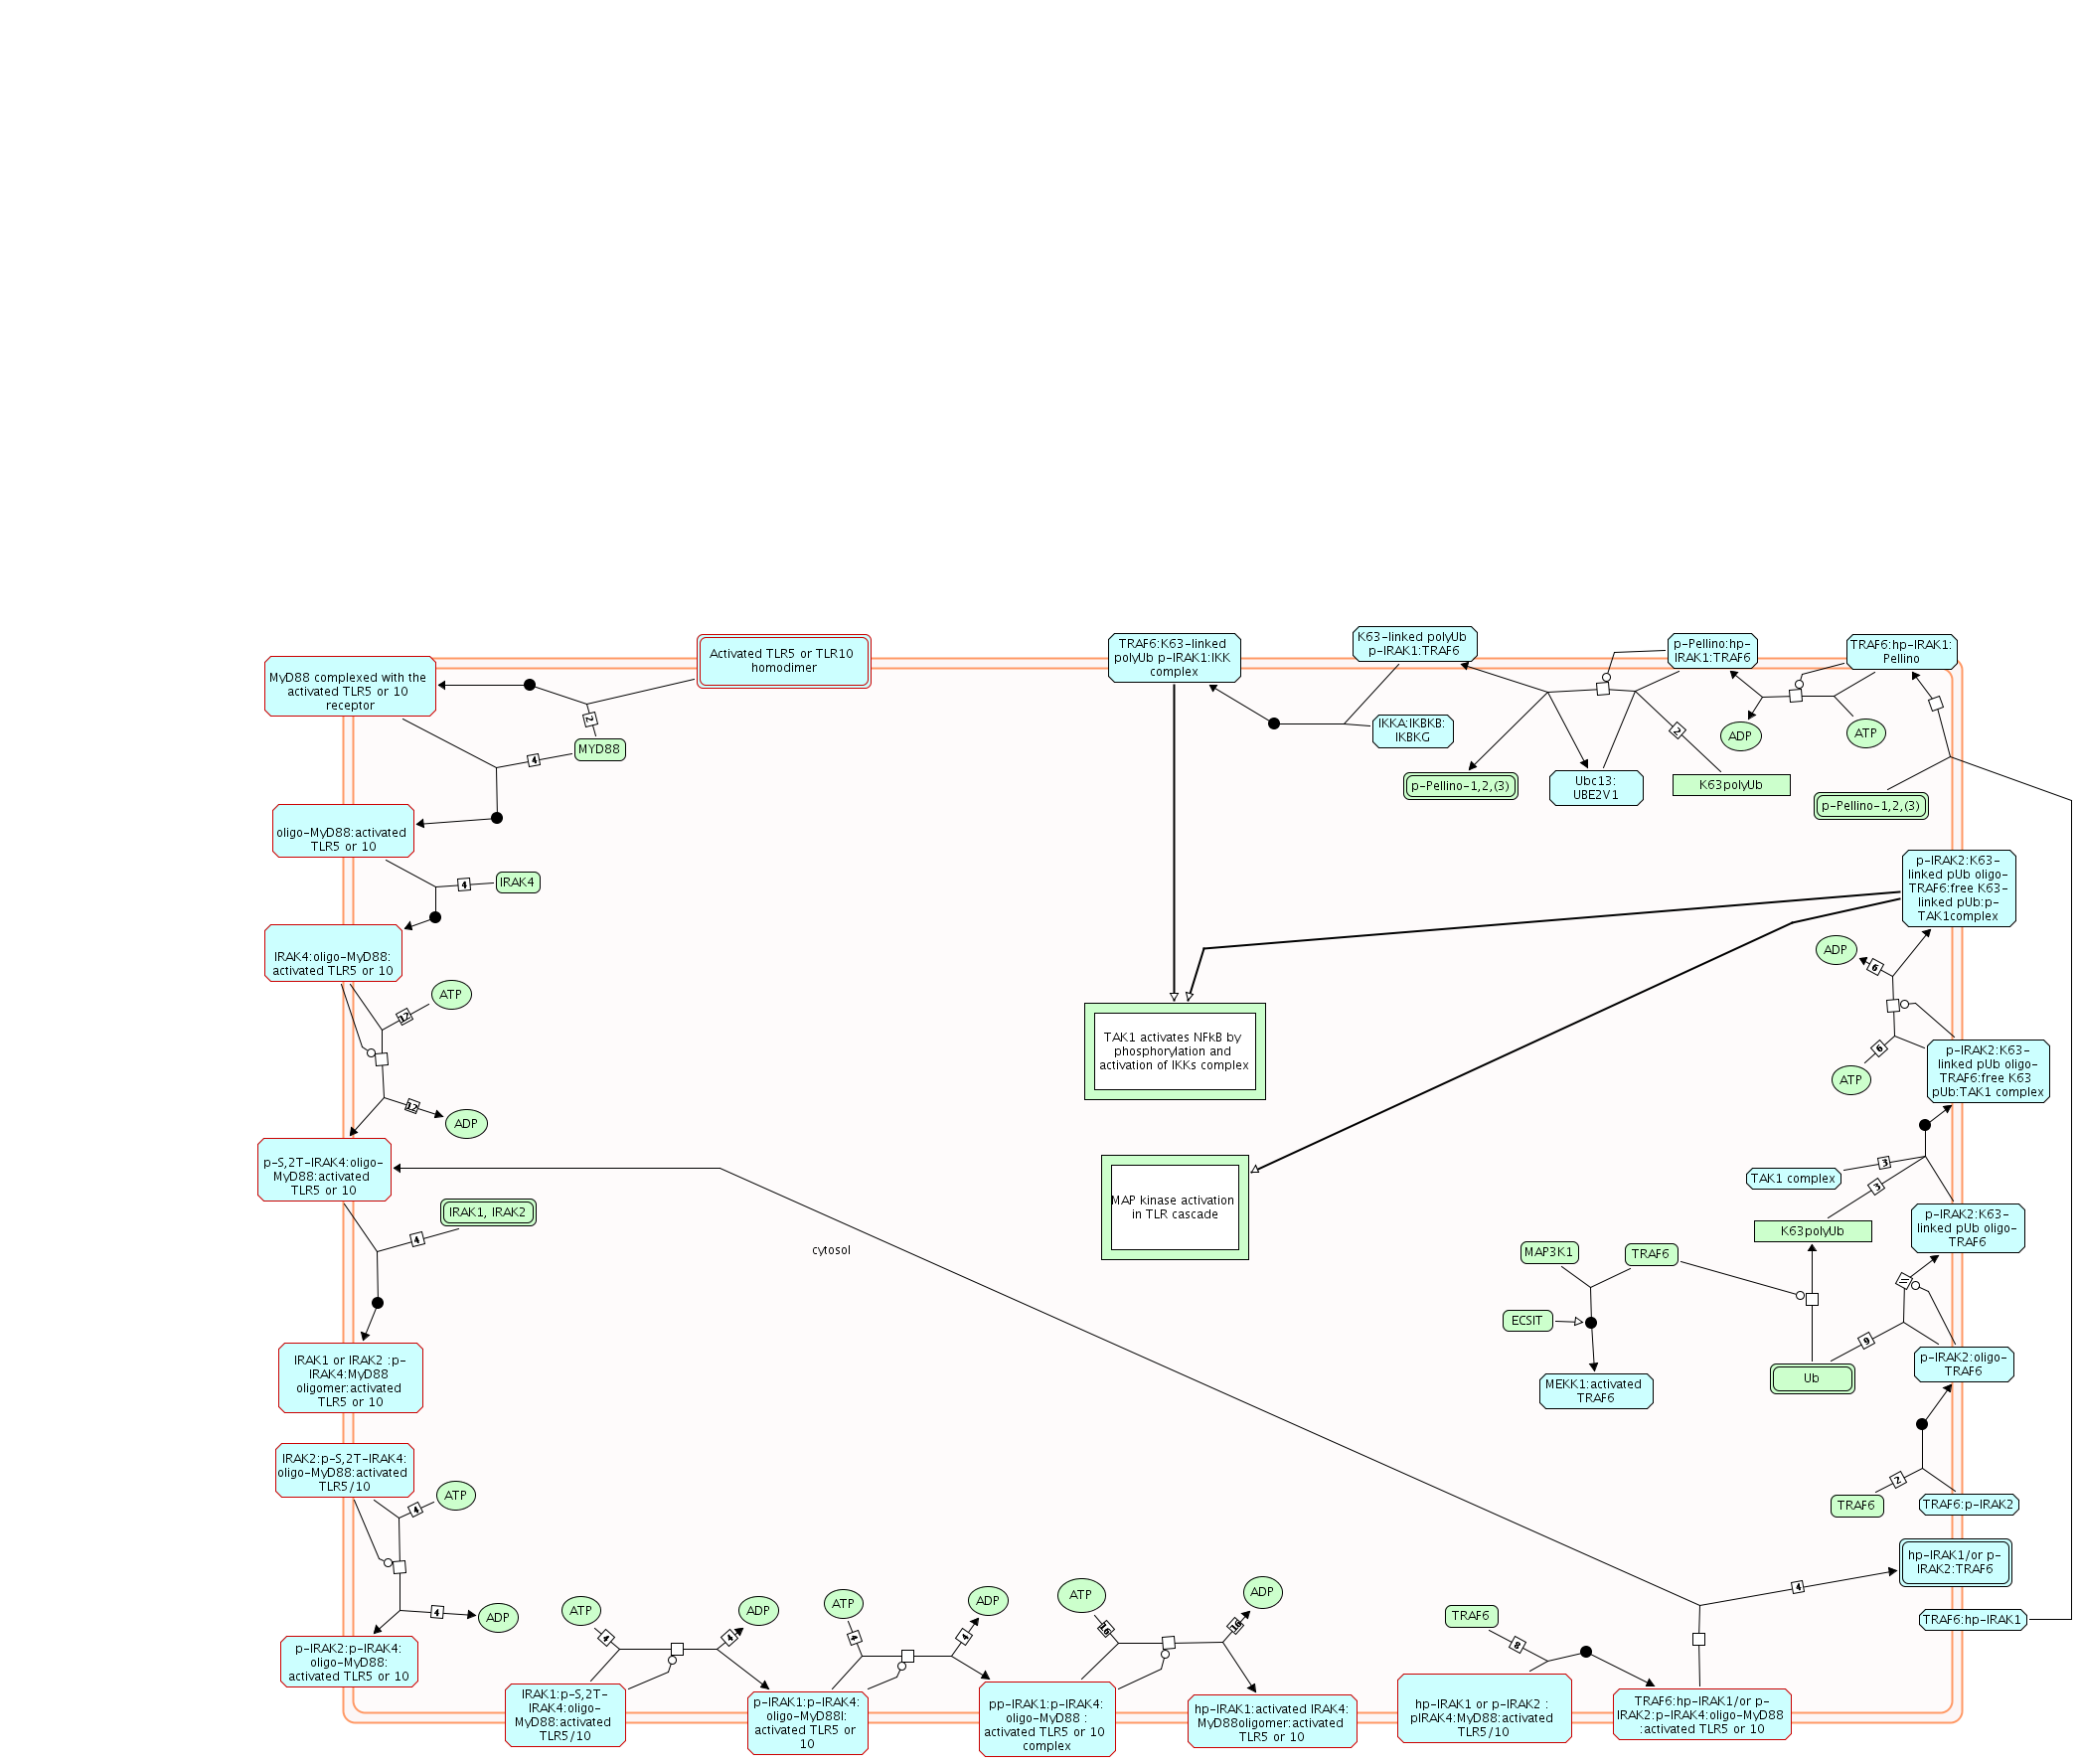
| Diagram of MyD88 cascade initiated on plasma membrane.png | 2025-05-14 16:56 | 179K | |
| Diagram of MyD88 cascade initiated on plasma membrane, MyD88 deficiency (TLR5), and IRAK4 deficiency (TLR5).png | 2025-05-14 16:56 | 179K | |
| Diagram of MyD88_Mal cascade initiated on plasma membrane.png | 2025-05-14 16:58 | 146K | |
| Diagram of MyD88_Mal cascade initiated on plasma membrane, MyD88 deficiency (TLR2-4), and IRAK4 deficiency (TLR2-4).png | 2025-05-14 16:59 | 146K | |
| Diagram of MyD88-independent cascade .png | 2025-05-14 17:00 | 167K | |
| Diagram of MyD88-independent cascade , TICAM1 deficiency - HSE, and TRAF3 deficiency - HSE.png | 2025-05-14 16:56 | 167K | |
| Diagram of Muscle contraction.png | 2025-05-14 17:00 | 2.1K | |
| Diagram of Mucopolysaccharidoses.png | 2025-05-14 16:57 | 9.4K | |
| Diagram of Mitotic Telophase-Cytokinesis.png | 2025-05-14 16:56 | 29K | |
| Diagram of Mitotic Prophase.png | 2025-05-14 17:00 | 247K | |
| Diagram of Mitotic Prometaphase.png | 2025-05-14 16:59 | 98K | |
| Diagram of Mitotic Metaphase and Anaphase.png | 2025-05-14 16:57 | 82K | |
| Diagram of Mitotic G2-G2-M phases.png | 2025-05-14 16:58 | 538K | |
| Diagram of Mitotic G1-G1-S phases.png | 2025-05-14 16:59 | 357K | |
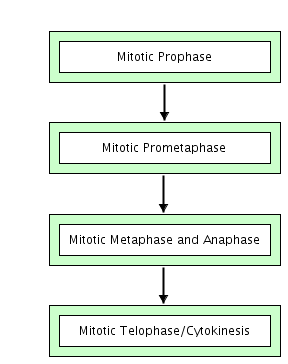
| Diagram of Mitotic.png | 2025-05-14 16:59 | 12K | |
| Diagram of Mitophagy.png | 2025-05-14 16:55 | 63K | |
| Diagram of Mitochondrial translation.png | 2025-05-14 16:58 | 141K | |
| Diagram of Mitochondrial protein import.png | 2025-05-14 16:59 | 84K | |
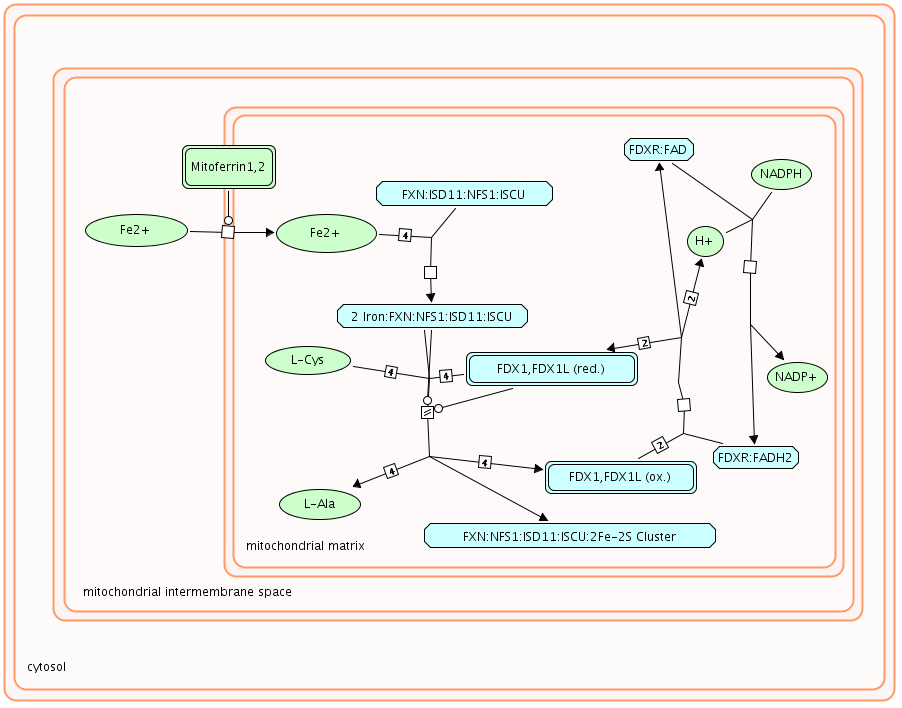
| Diagram of Mitochondrial iron-sulfur cluster biogenesis.png | 2025-05-14 16:57 | 46K | |
| Diagram of Mitochondrial biogenesis.png | 2025-05-14 17:00 | 265K | |
| Diagram of Mitochondrial Transcription.png | 2025-05-14 17:00 | 276K | |
| Diagram of Misspliced LRP5 mutants have enhanced beta-catenin-dependent signaling.png | 2025-05-14 16:58 | 492K | |
| Diagram of Misspliced GSK3beta mutants stabilize beta-catenin.png | 2025-05-14 16:58 | 148K | |
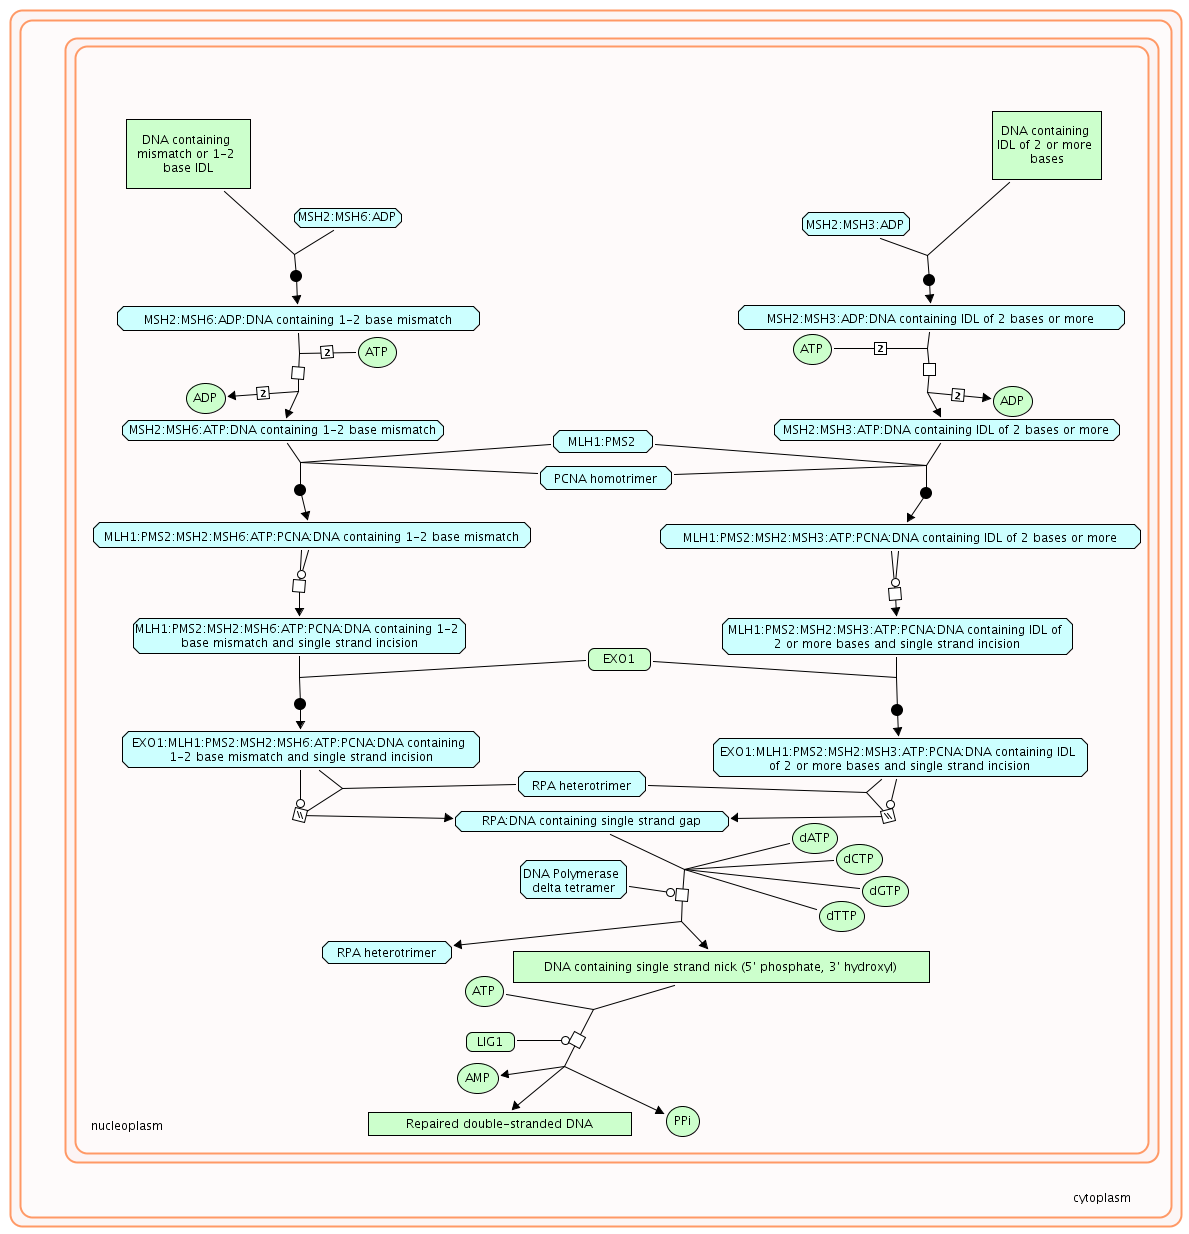
| Diagram of Mismatch Repair.png | 2025-05-14 16:57 | 89K | |
| Diagram of Mismatch Repair, Defective Mismatch Repair Associated With MLH1, Defective Mismatch Repair Associated With MSH2, Defective Mismatch Repair Associated With MSH3, Defective Mismatch Repair Associated With MSH6, and Defective Mismatch Repair .png | 2025-05-14 16:59 | 89K | |
| Diagram of Miscellaneous transport and binding events.png | 2025-05-14 16:56 | 52K | |
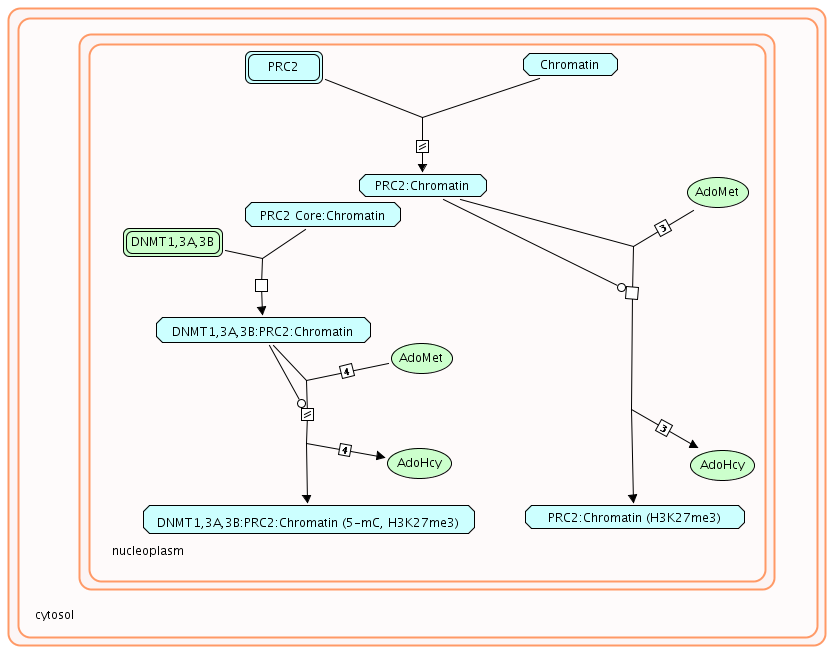
| Diagram of Methylation of Histones and DNA by PRC2.png | 2025-05-14 16:57 | 34K | |
| Diagram of Metallothioneins bind metals.png | 2025-05-14 16:56 | 163K | |
| Diagram of Metabolism of water-soluble vitamins cofactors.png | 2025-05-14 16:59 | 593K | |
| Diagram of Metabolism of water-soluble vitamins and cofactors, Defective AMN causes hereditary megaloblastic anemia 1, Defective CD320 causes methylmalonic aciduria, Defective CUBN causes hereditary megaloblastic anemia 1, Defective GIF causes intrins.png | 2025-05-14 16:55 | 593K | |
| Diagram of Metabolism of vitamins and cofactors.png | 2025-05-14 17:00 | 2.5K | |
| Diagram of Metabolism of vitamin K.png | 2025-05-14 16:56 | 27K | |
| Diagram of Metabolism of steroid hormones.png | 2025-05-14 16:58 | 335K | |
| Diagram of Metabolism of proteins.png | 2025-05-14 17:01 | 10K | |
| Diagram of Metabolism of porphyrins.png | 2025-05-14 16:57 | 140K | |
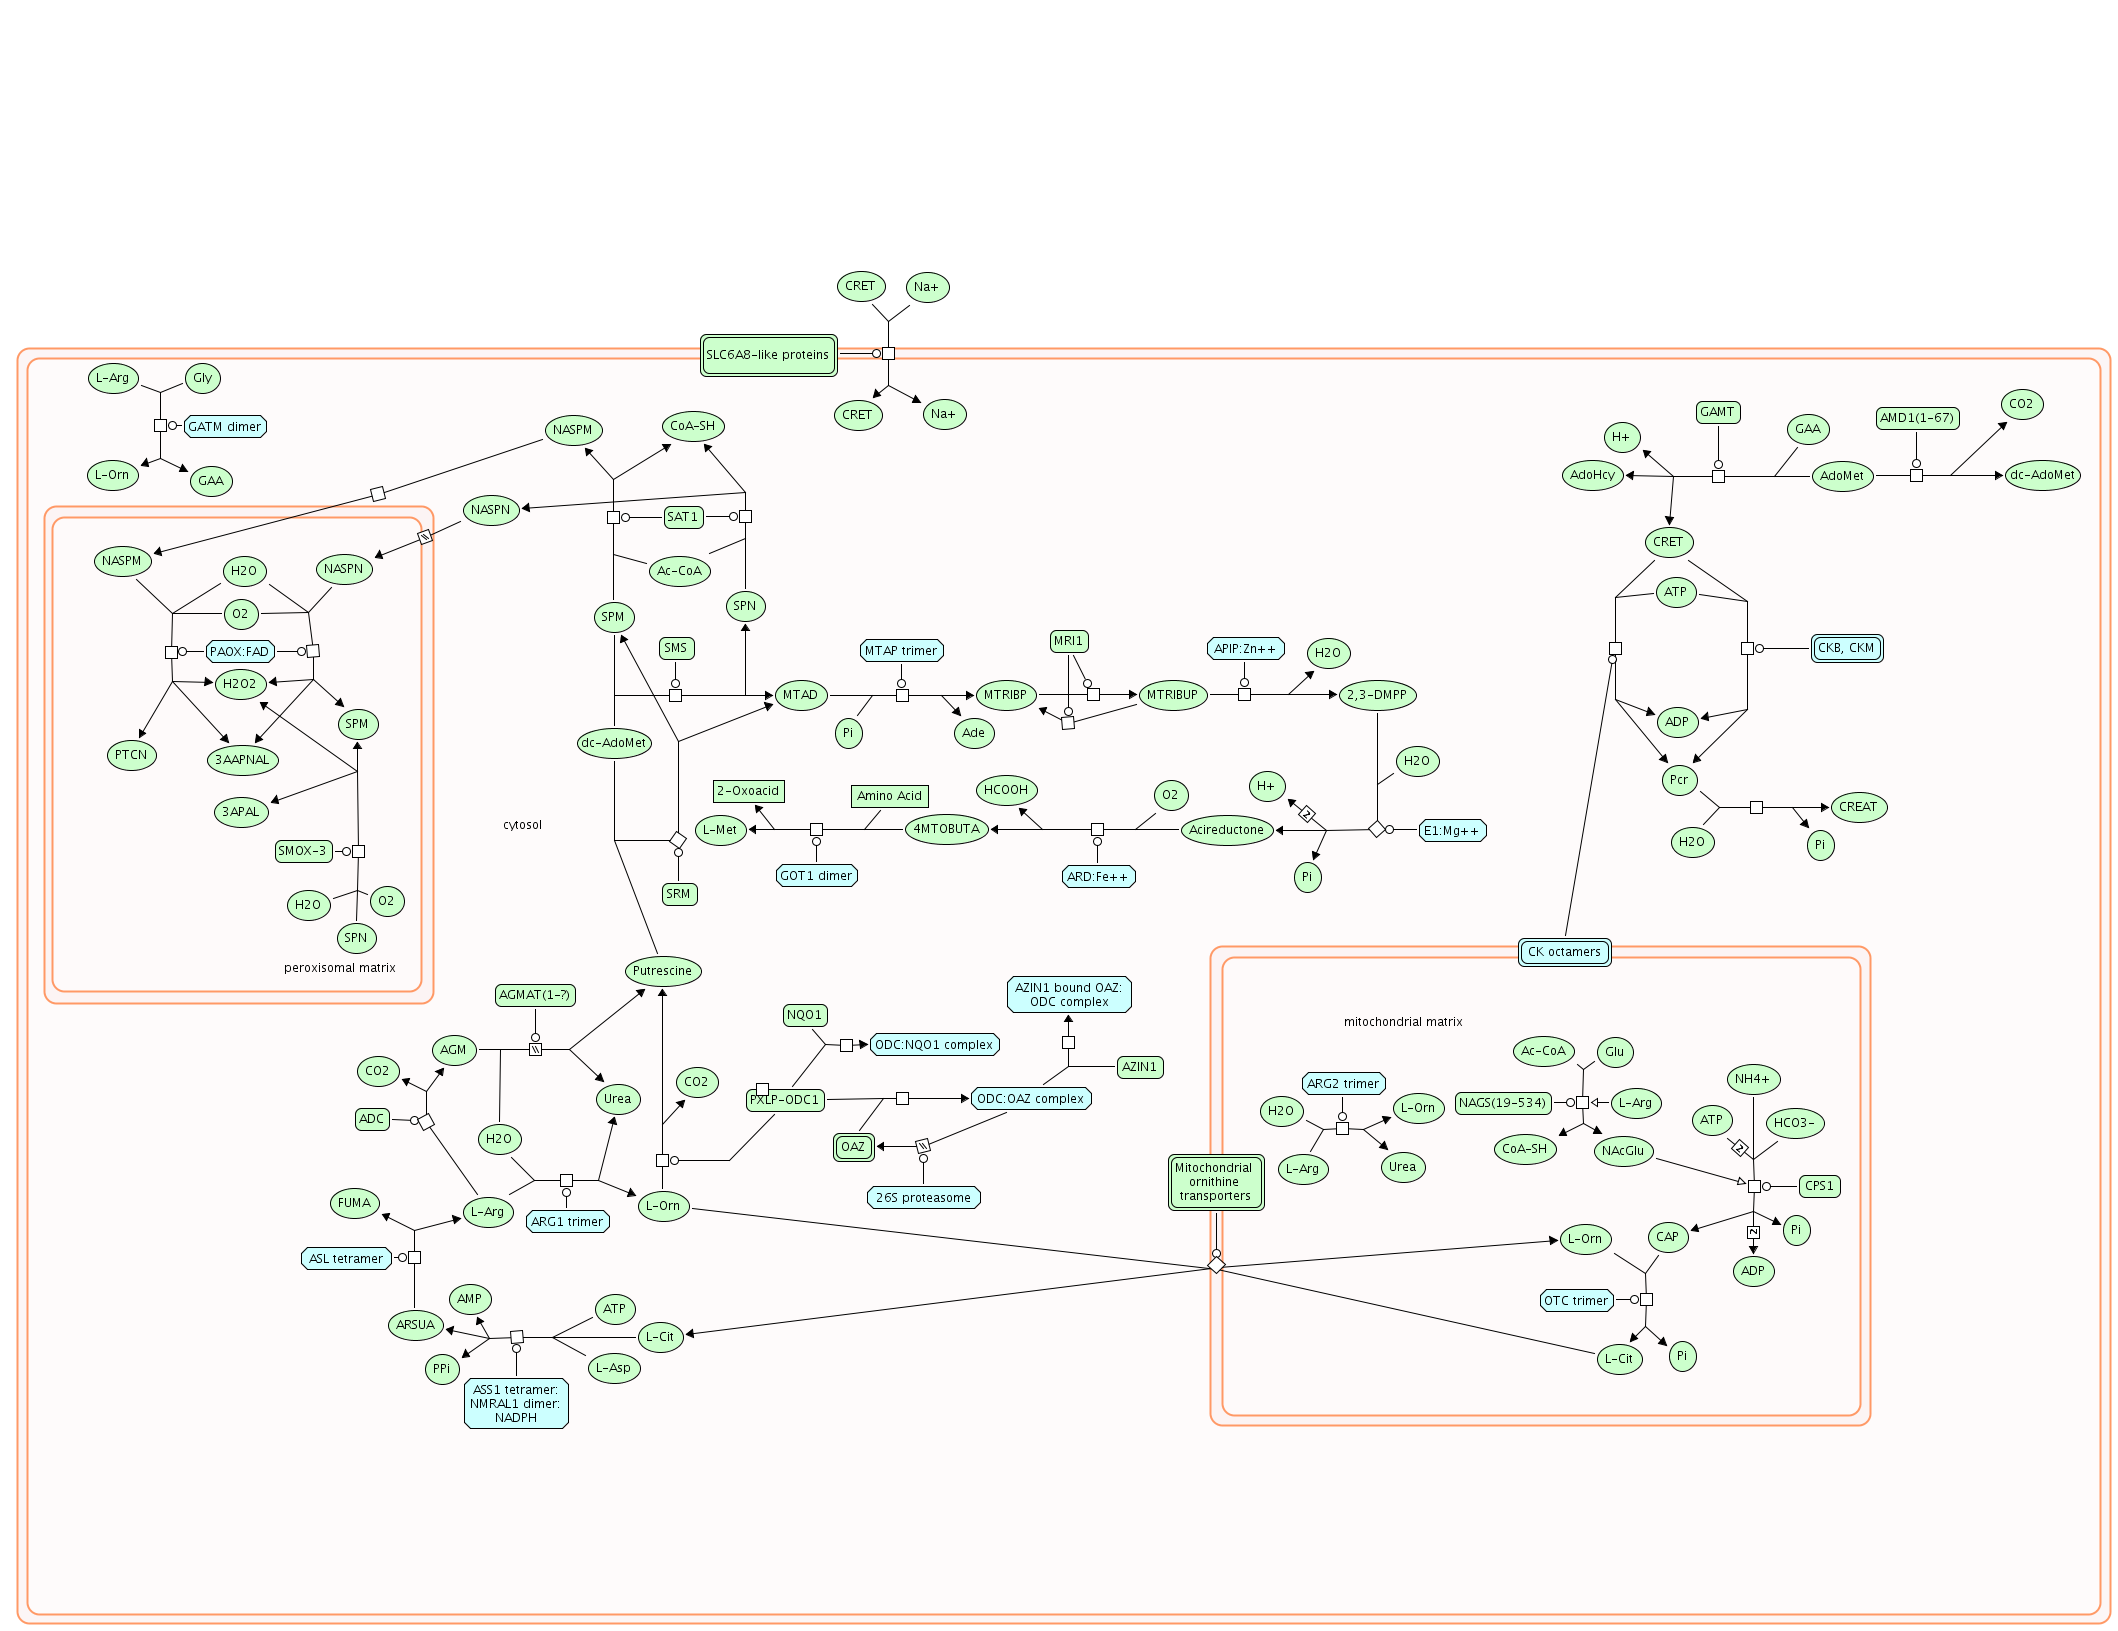
| Diagram of Metabolism of polyamines.png | 2025-05-14 17:00 | 229K | |
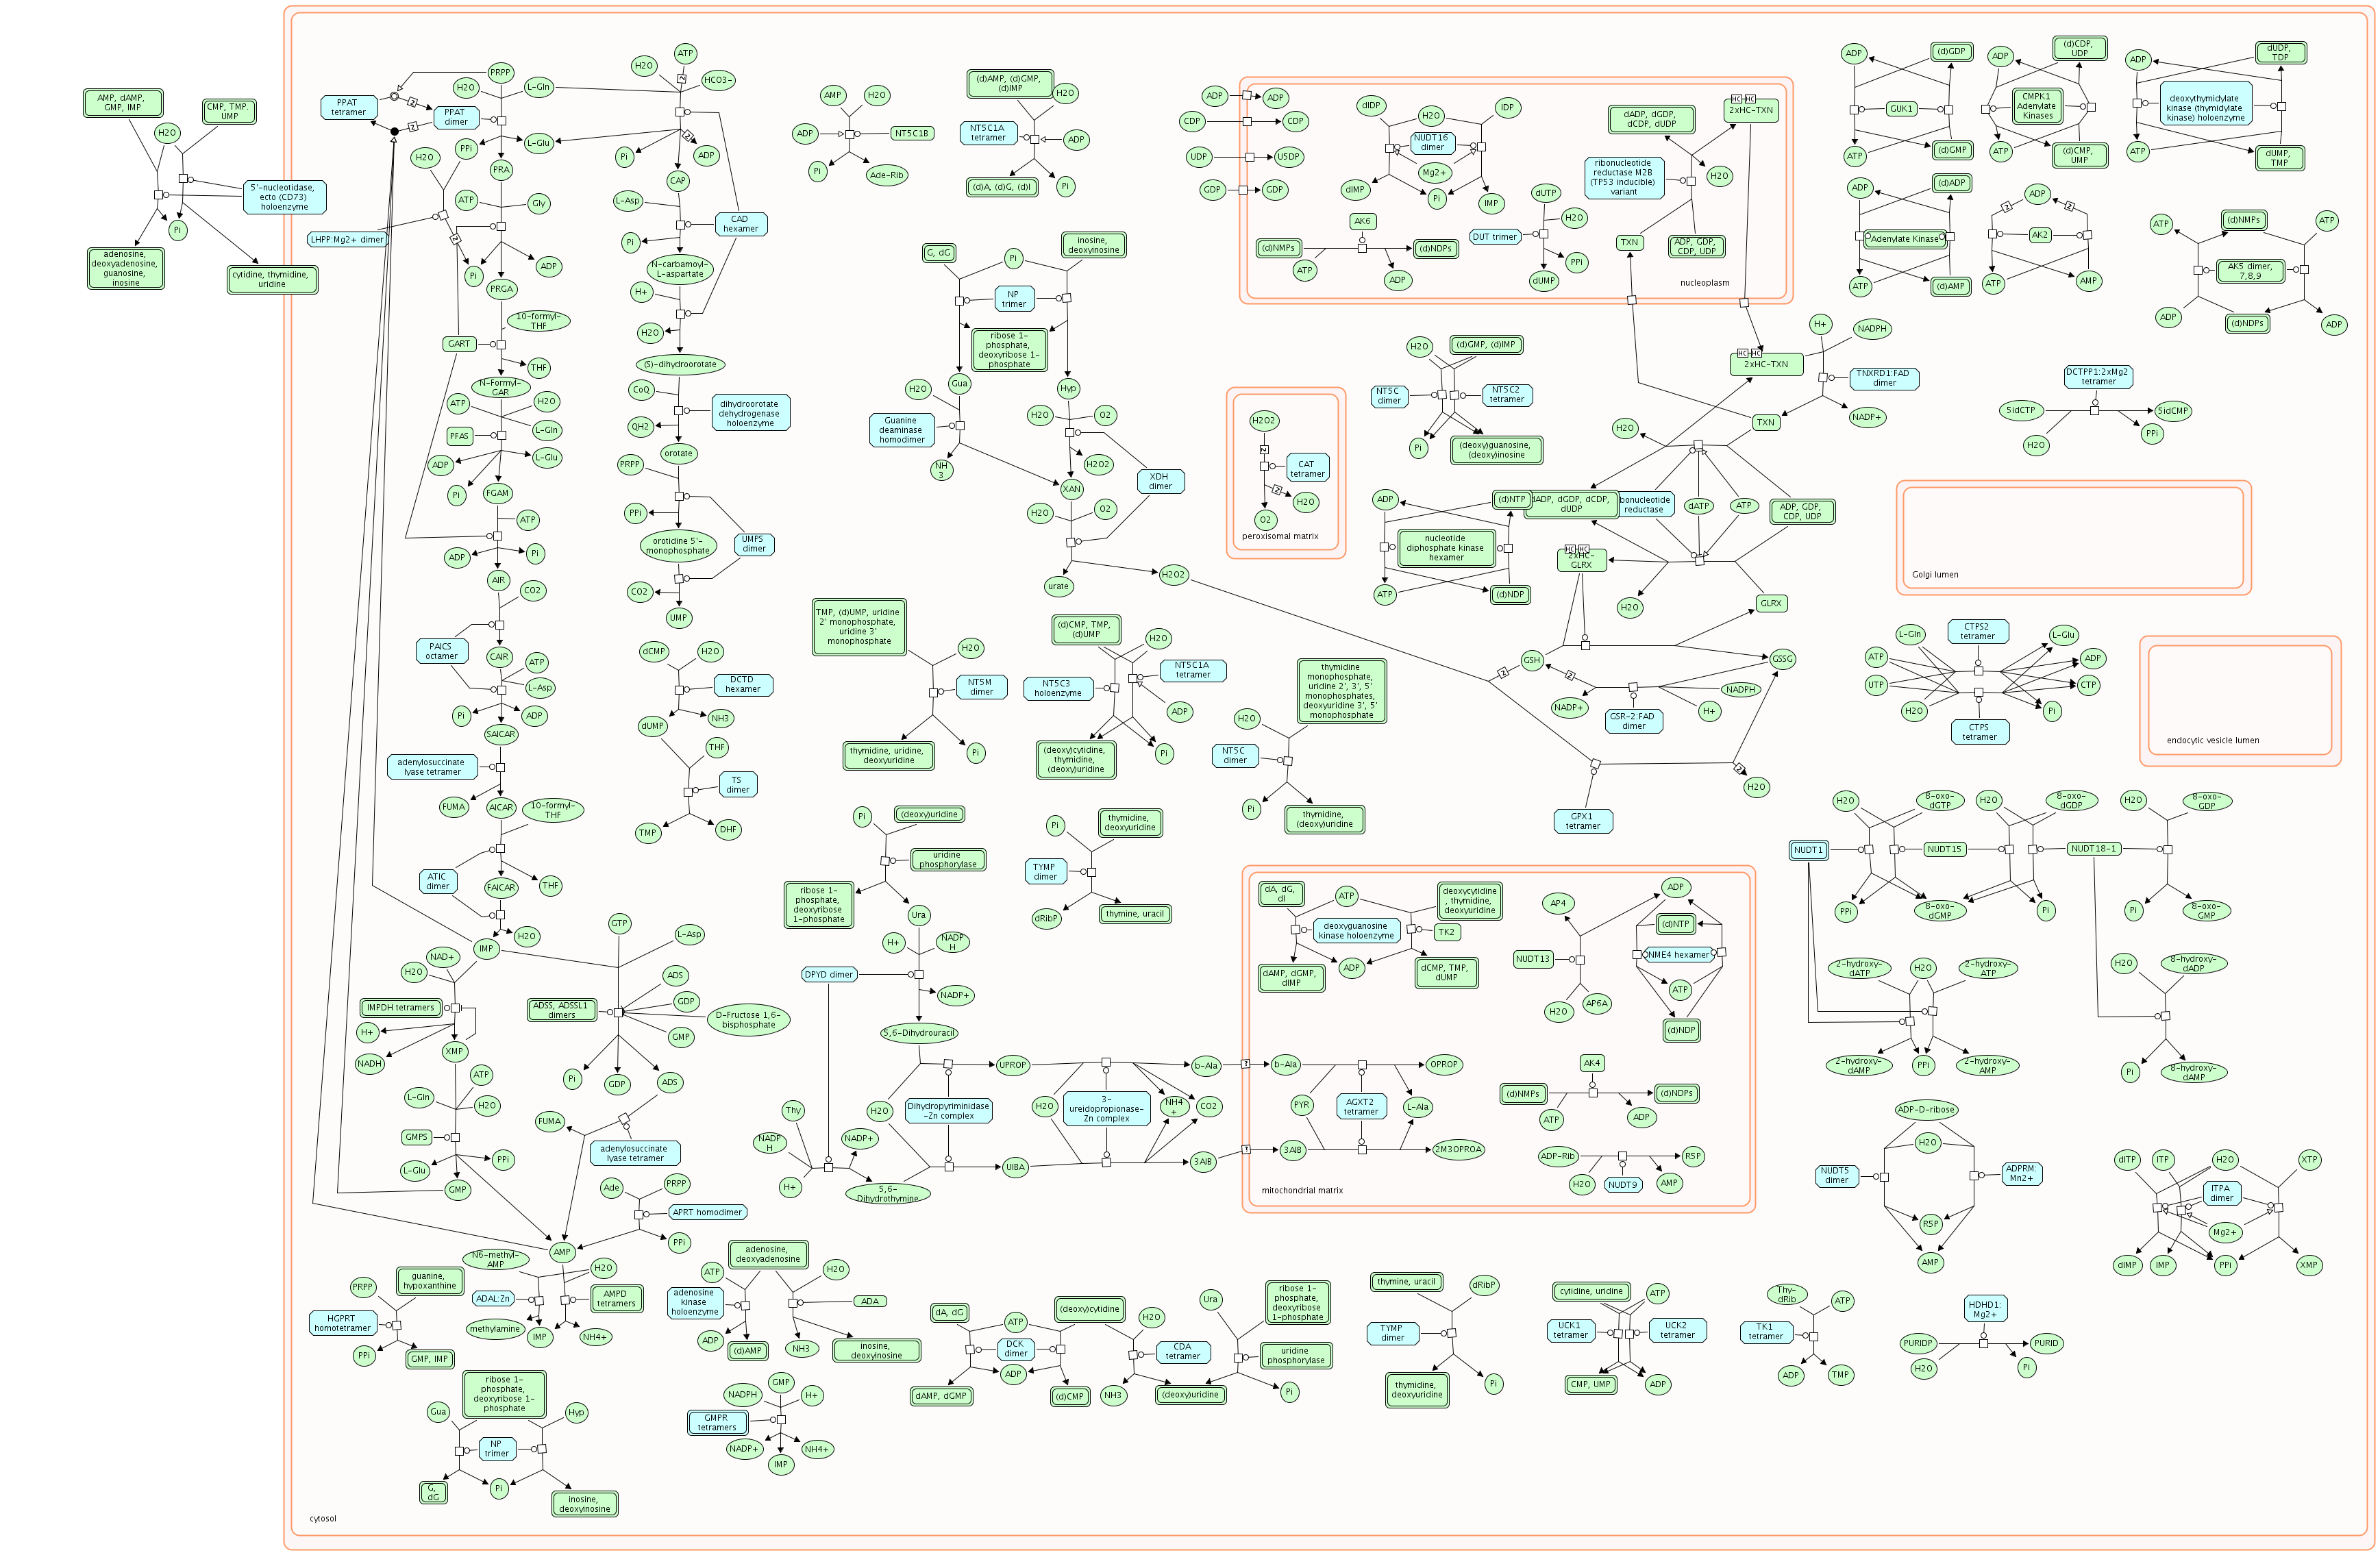
| Diagram of Metabolism of nucleotides.png | 2025-05-14 16:57 | 852K | |
| Diagram of Metabolism of non-coding RNA.png | 2025-05-14 16:55 | 59K | |
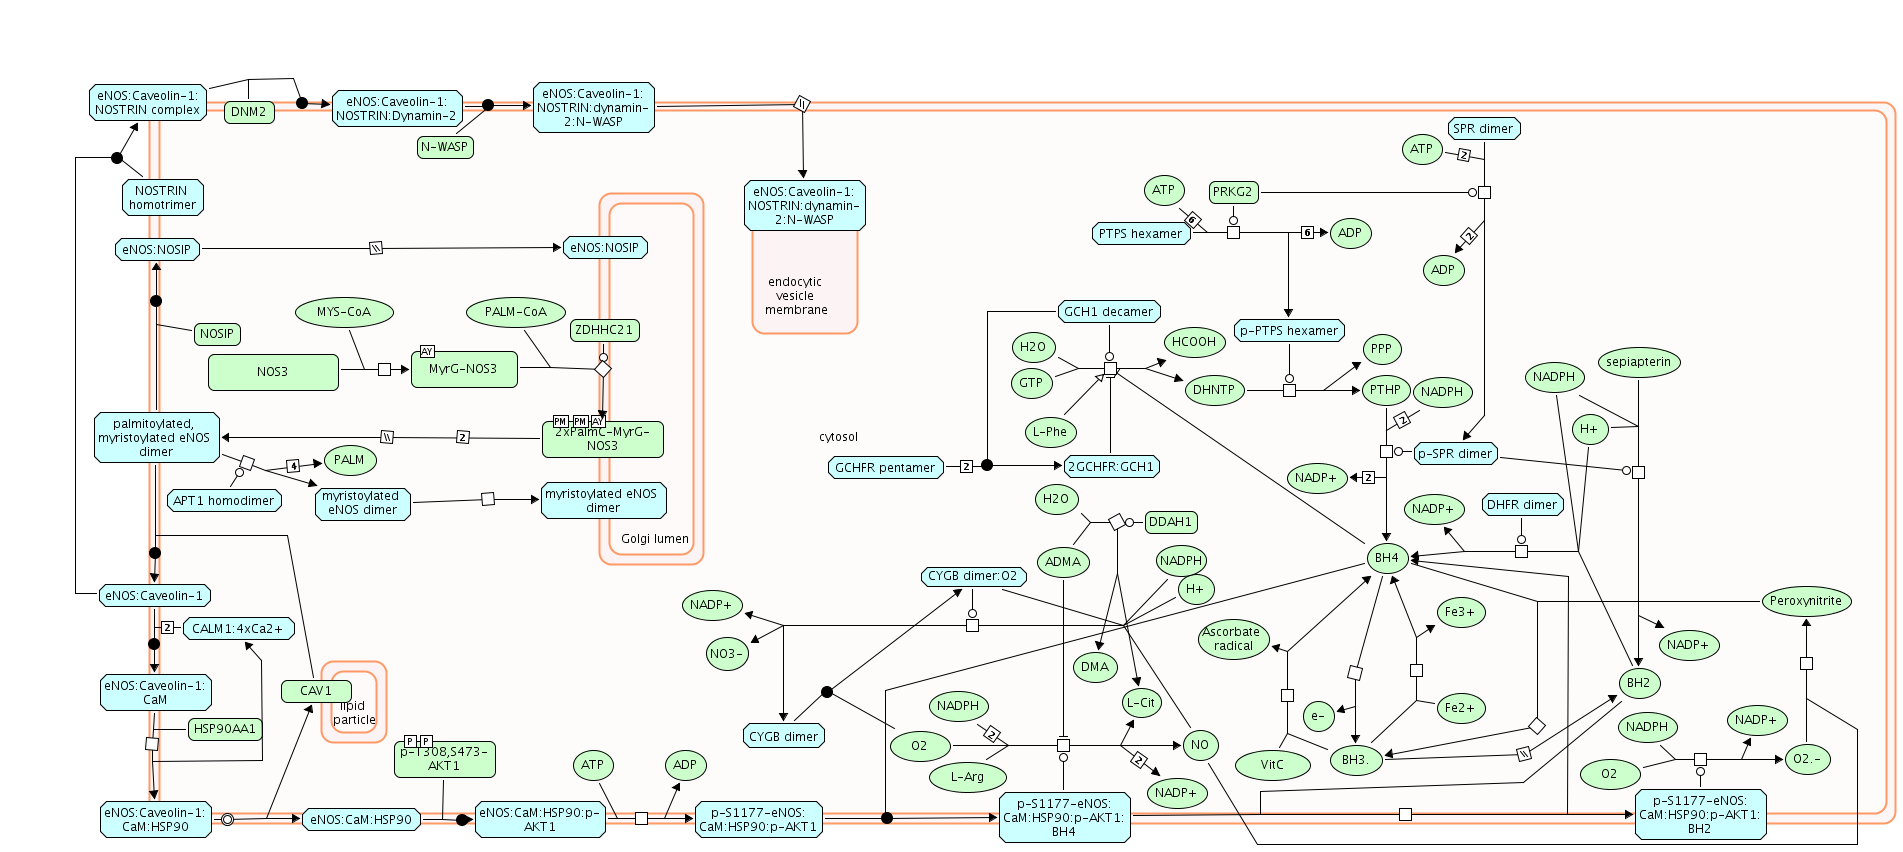
| Diagram of Metabolism of nitric oxide.png | 2025-05-14 16:57 | 184K | |
| Diagram of Metabolism of lipids and lipoproteins.png | 2025-05-14 16:55 | 29K | |
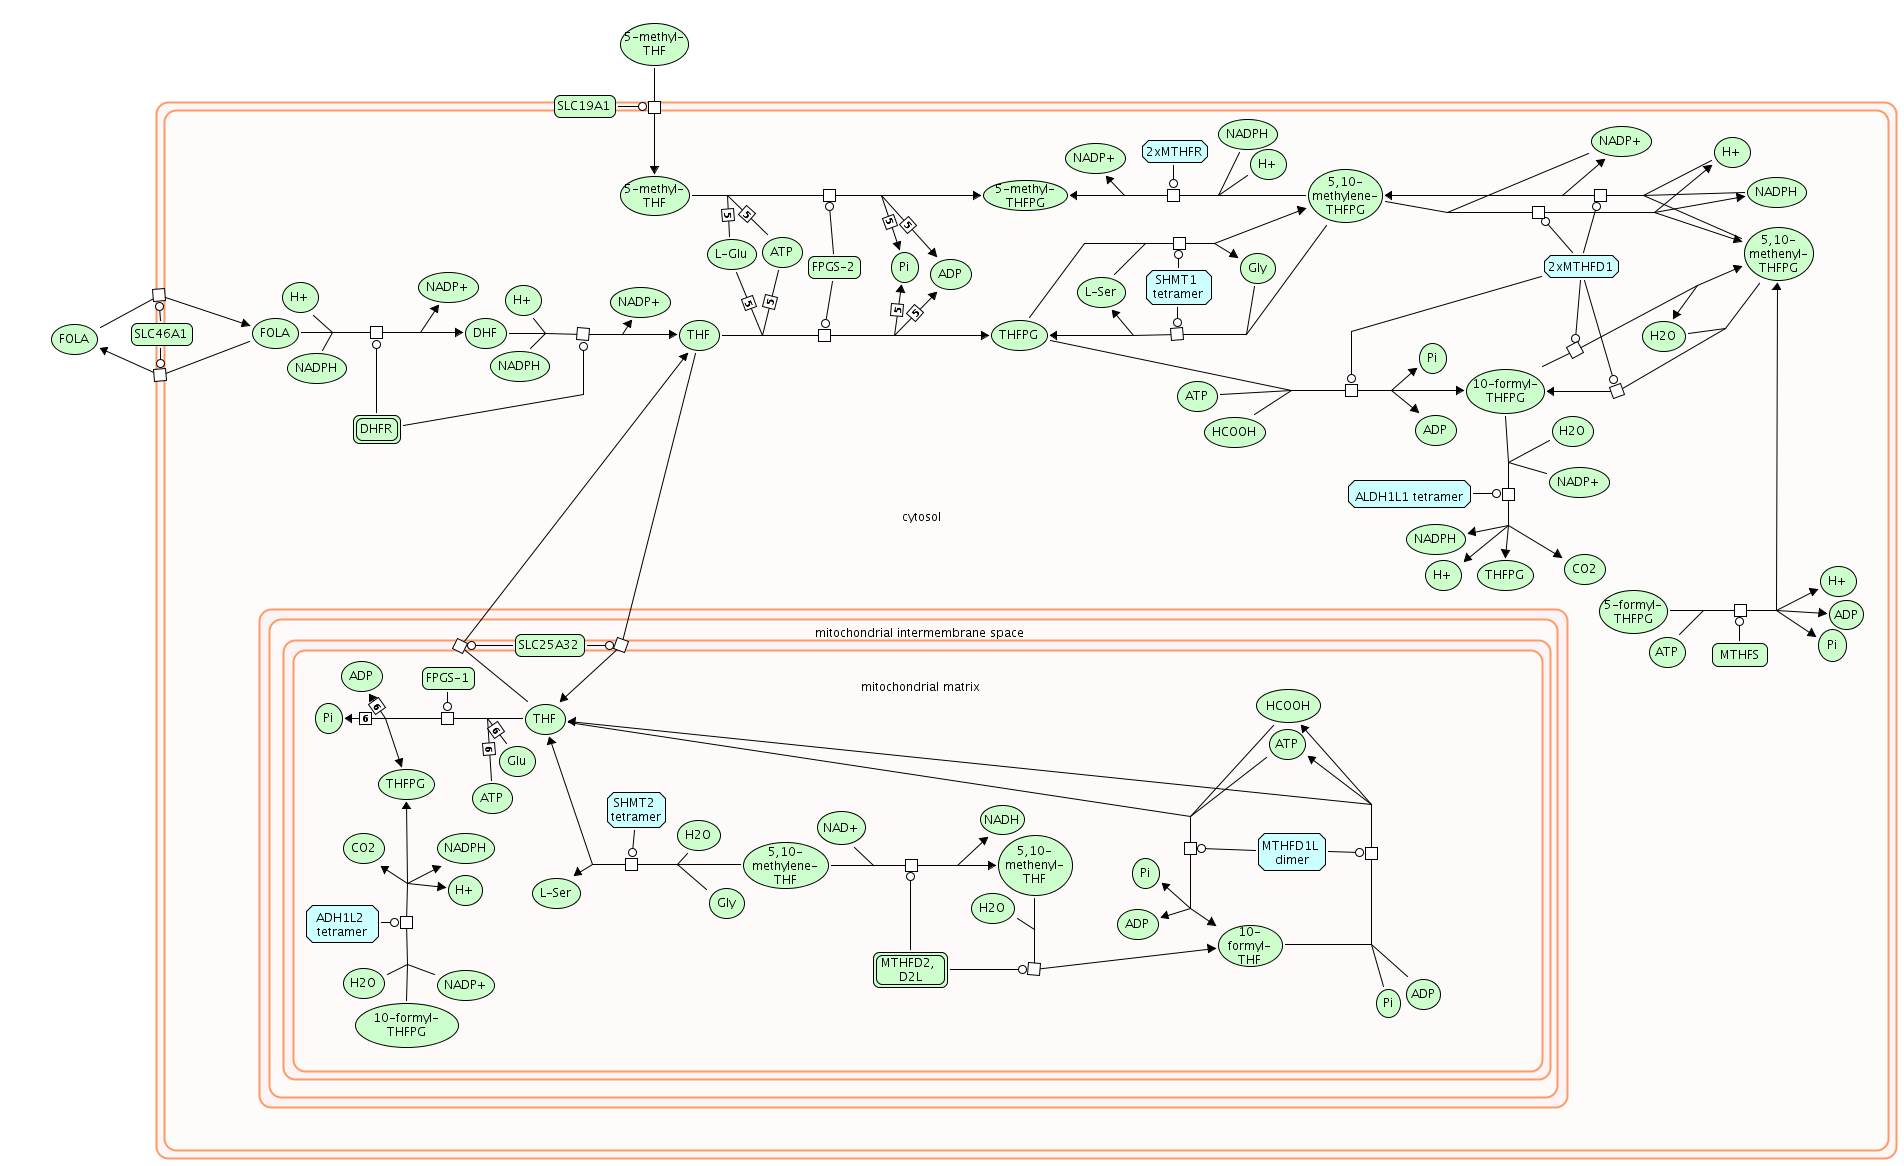
| Diagram of Metabolism of folate and pterines.png | 2025-05-14 16:58 | 193K | |
| Diagram of Metabolism of fat-soluble vitamins.png | 2025-05-14 16:56 | 2.7K | |
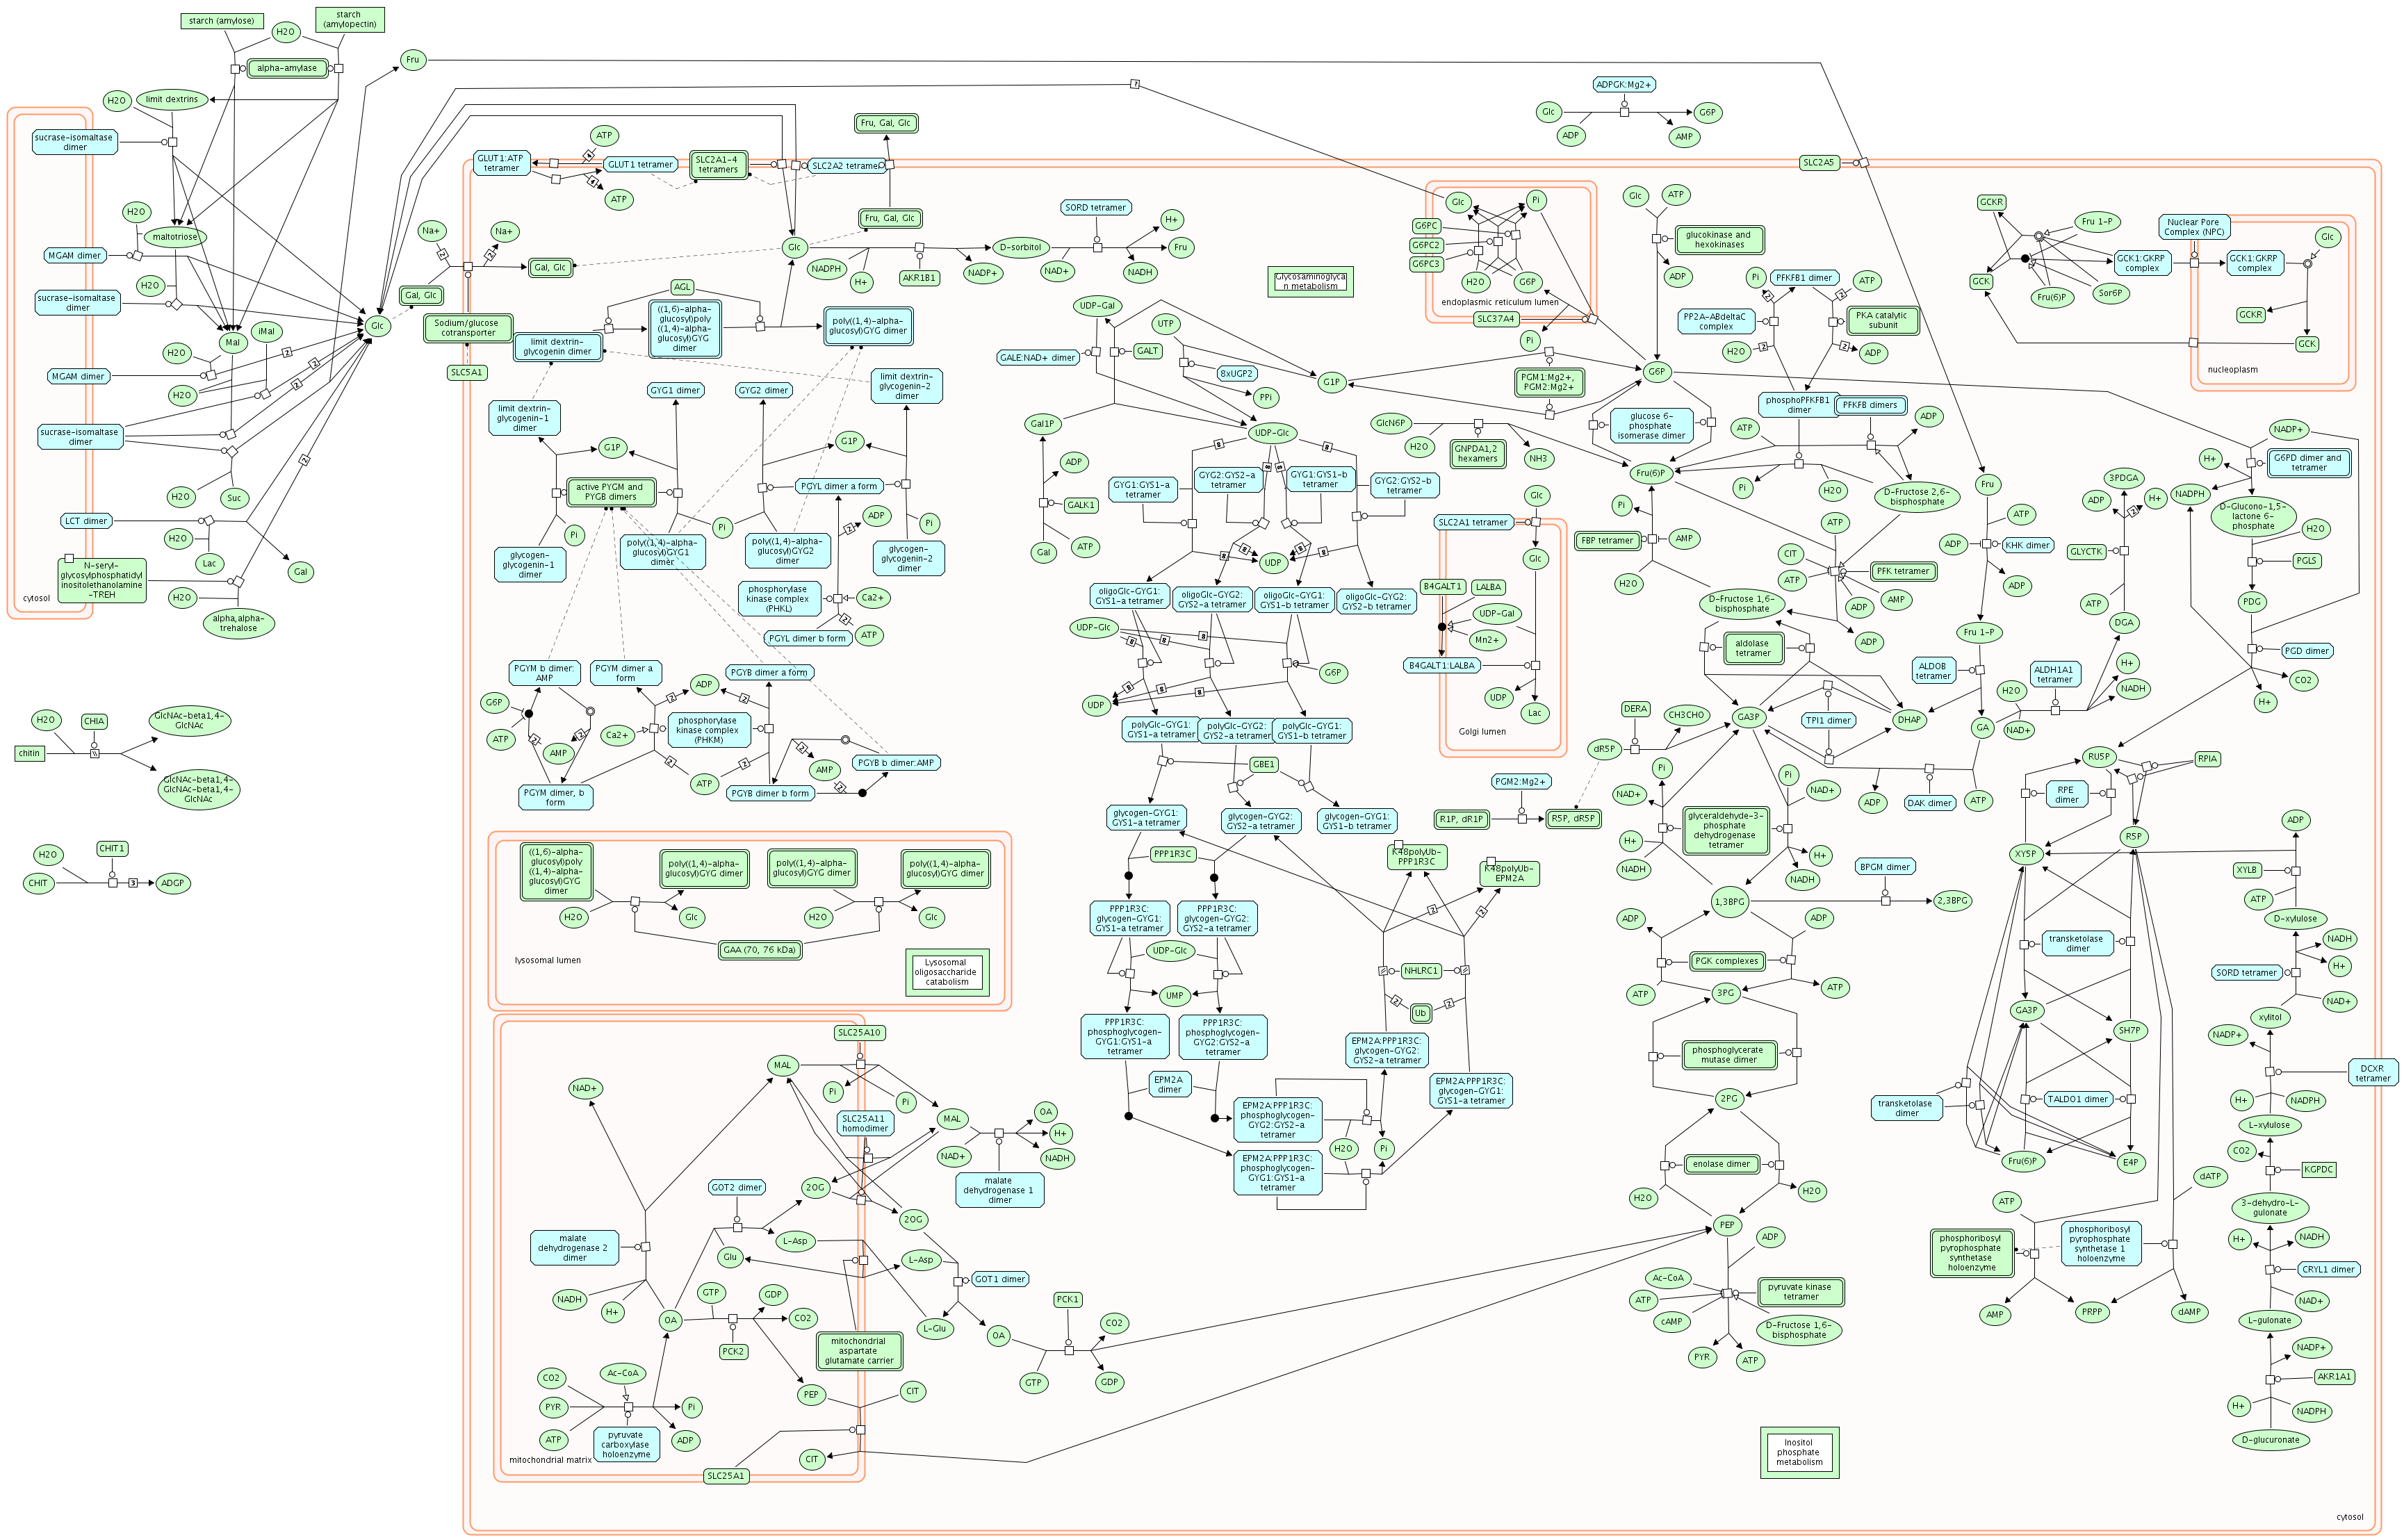
| Diagram of Metabolism of carbohydrates.png | 2025-05-14 16:59 | 926K | |
| Diagram of Metabolism of carbohydrates, Glycogen storage disease type 0 (muscle GYS1), Glycogen storage disease type 0 (liver GYS2), Glycogen storage disease type II (GAA), Glycogen storage disease type IV (GBE1), Glycogen storage disease type XV (GYG.png | 2025-05-14 16:57 | 926K | |
| Diagram of Metabolism of amino acids and derivatives.png | 2025-05-14 16:59 | 10K | |
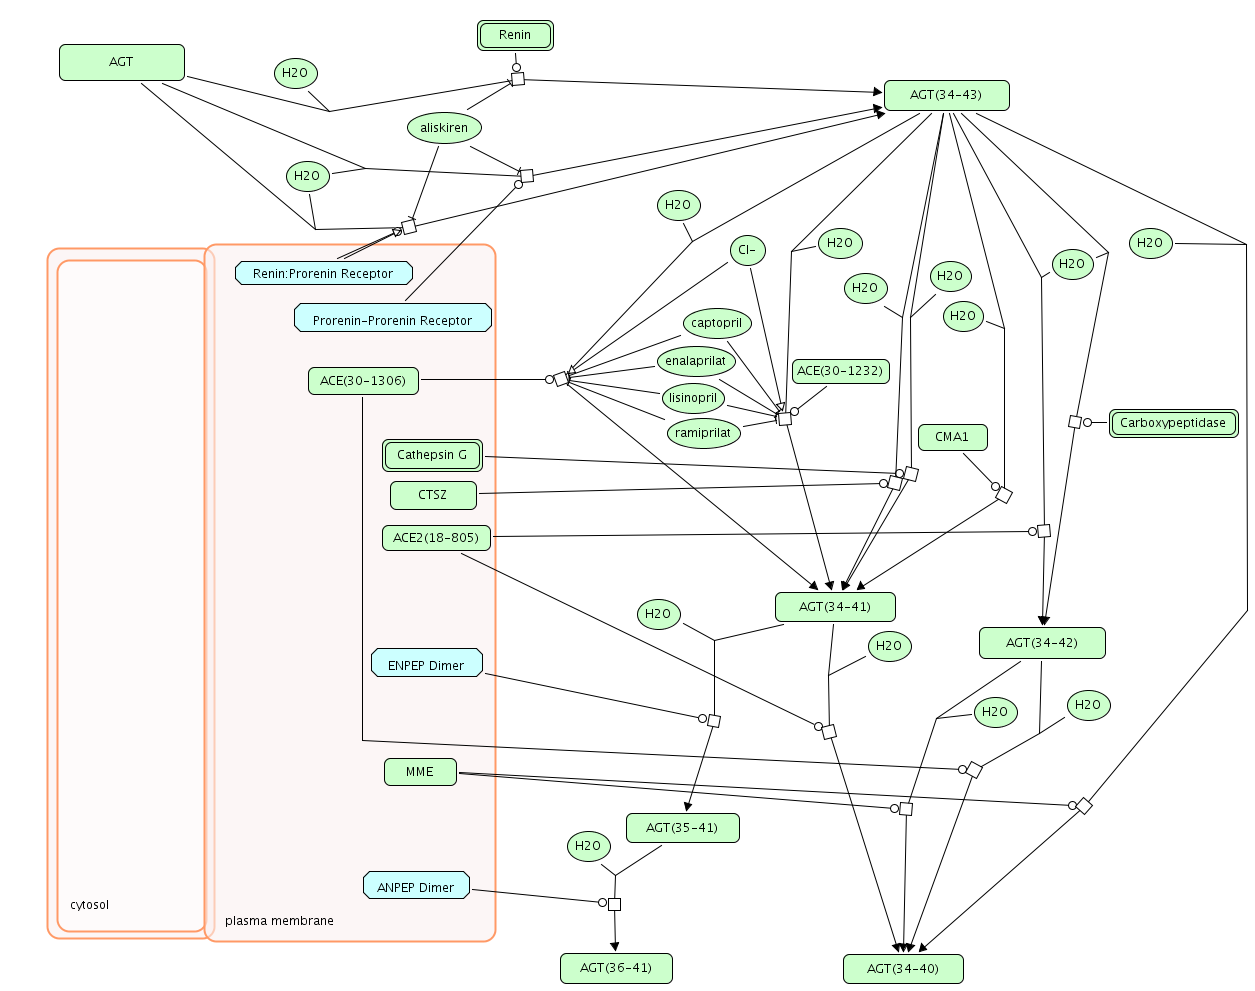
| Diagram of Metabolism of Angiotensinogen to Angiotensins.png | 2025-05-14 16:56 | 148K | |
| Diagram of Metabolism.png | 2025-05-14 17:00 | 23K | |
| Diagram of Metabolic disorders of biological oxidation enzymes.png | 2025-05-14 17:00 | 49K | |
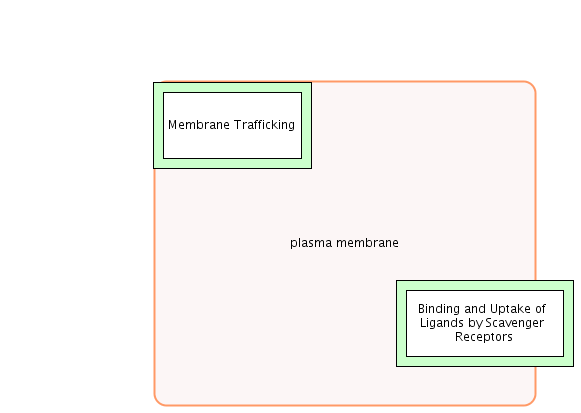
| Diagram of Membrane Trafficking.png | 2025-05-14 16:56 | 37K | |
| Diagram of Melanin biosynthesis.png | 2025-05-14 16:55 | 74K | |
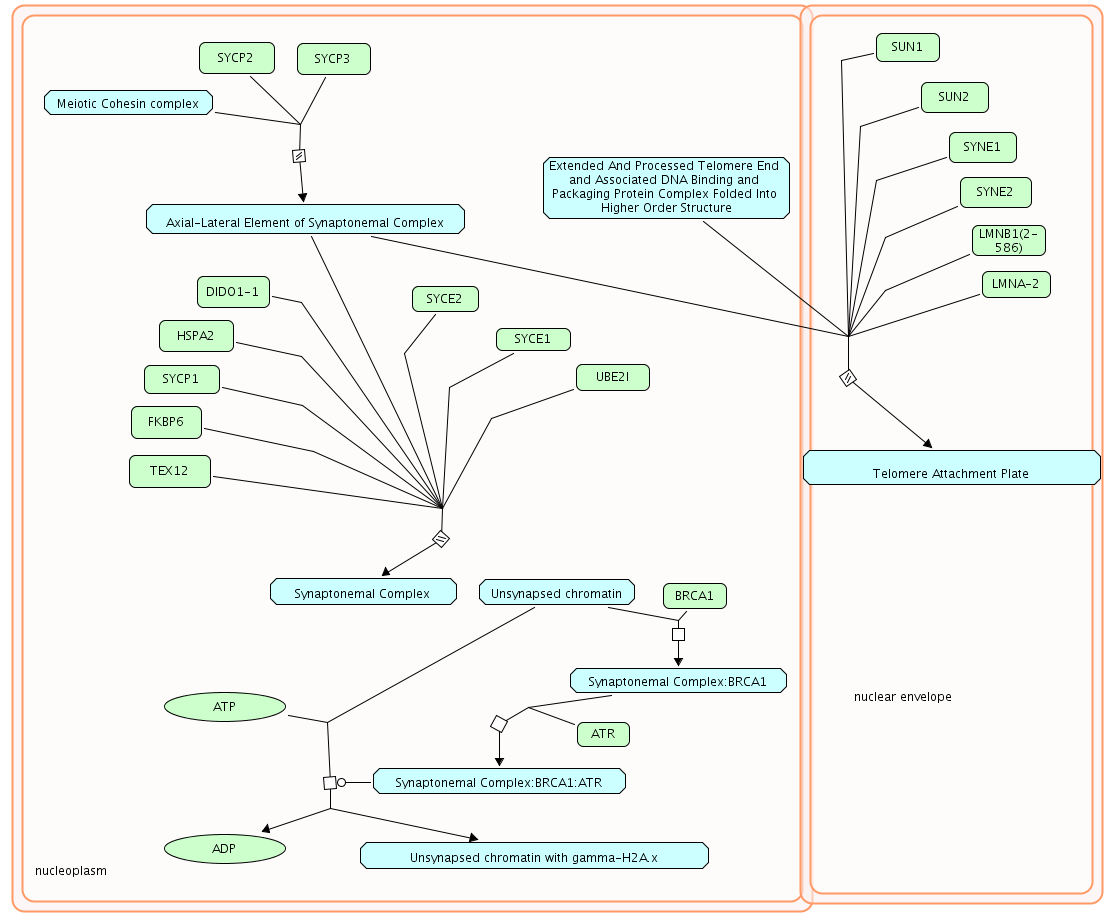
| Diagram of Meiotic synapsis.png | 2025-05-14 16:59 | 81K | |
| Diagram of Meiotic recombination.png | 2025-05-14 17:00 | 130K | |
| Diagram of Meiosis.png | 2025-05-14 16:59 | 5.9K | |
| Diagram of Major pathway of rRNA processing in the nucleolus.png | 2025-05-14 16:57 | 58K | |
| Diagram of Macroautophagy.png | 2025-05-14 17:00 | 232K | |
| Diagram of M Phase.png | 2025-05-14 16:59 | 5.2K | |
| Diagram of MPS IV - Morquio syndro.png | 2025-05-14 16:58 | 548K | |
| Diagram of MPS IIID - Sanfilippo syndrome D.png | 2025-05-14 17:00 | 548K | |
| Diagram of MPS IIIC - Sanfilippo syndrome C.png | 2025-05-14 16:59 | 548K | |
| Diagram of MPS IIIB - Sanfilippo syndrome B.png | 2025-05-14 16:56 | 548K | |
| Diagram of MPS IIIA - Sanfilippo syndrome A.png | 2025-05-14 16:58 | 548K | |
| Diagram of MPS II - Hunter syndrome.png | 2025-05-14 17:00 | 548K | |
| Diagram of MPS I - Hurler syndrome.png | 2025-05-14 17:00 | 548K | |
| Diagram of MHC class II antigen presentation.png | 2025-05-14 17:01 | 192K | |
| Diagram of MAP kinase activation in TLR cascade.png | 2025-05-14 16:59 | 92K | |
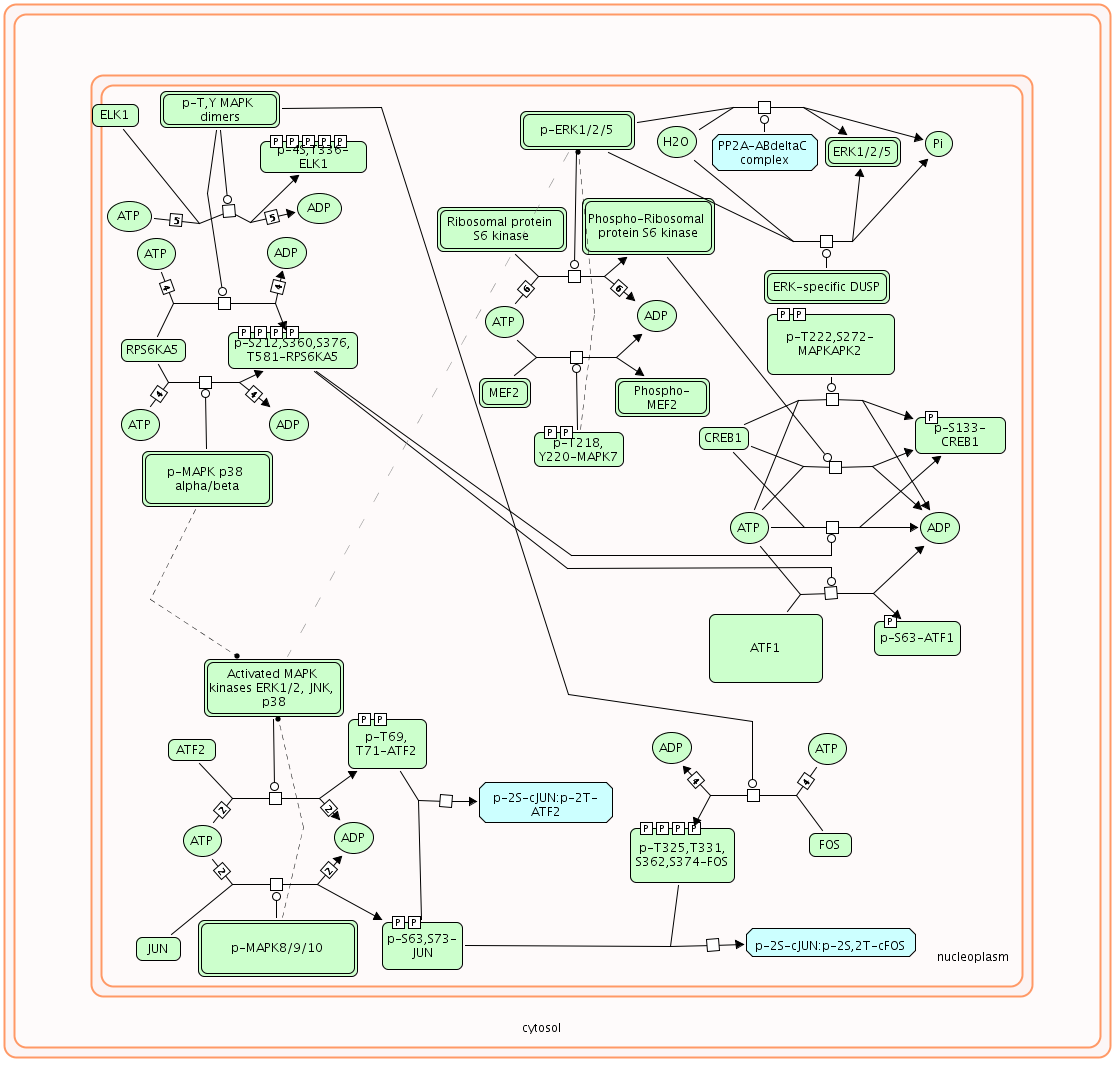
| Diagram of MAPK targets- Nuclear events mediated by MAP kinases.png | 2025-05-14 16:59 | 116K | |
| Diagram of MAPK family signaling cascades.png | 2025-05-14 16:55 | 2.1K | |
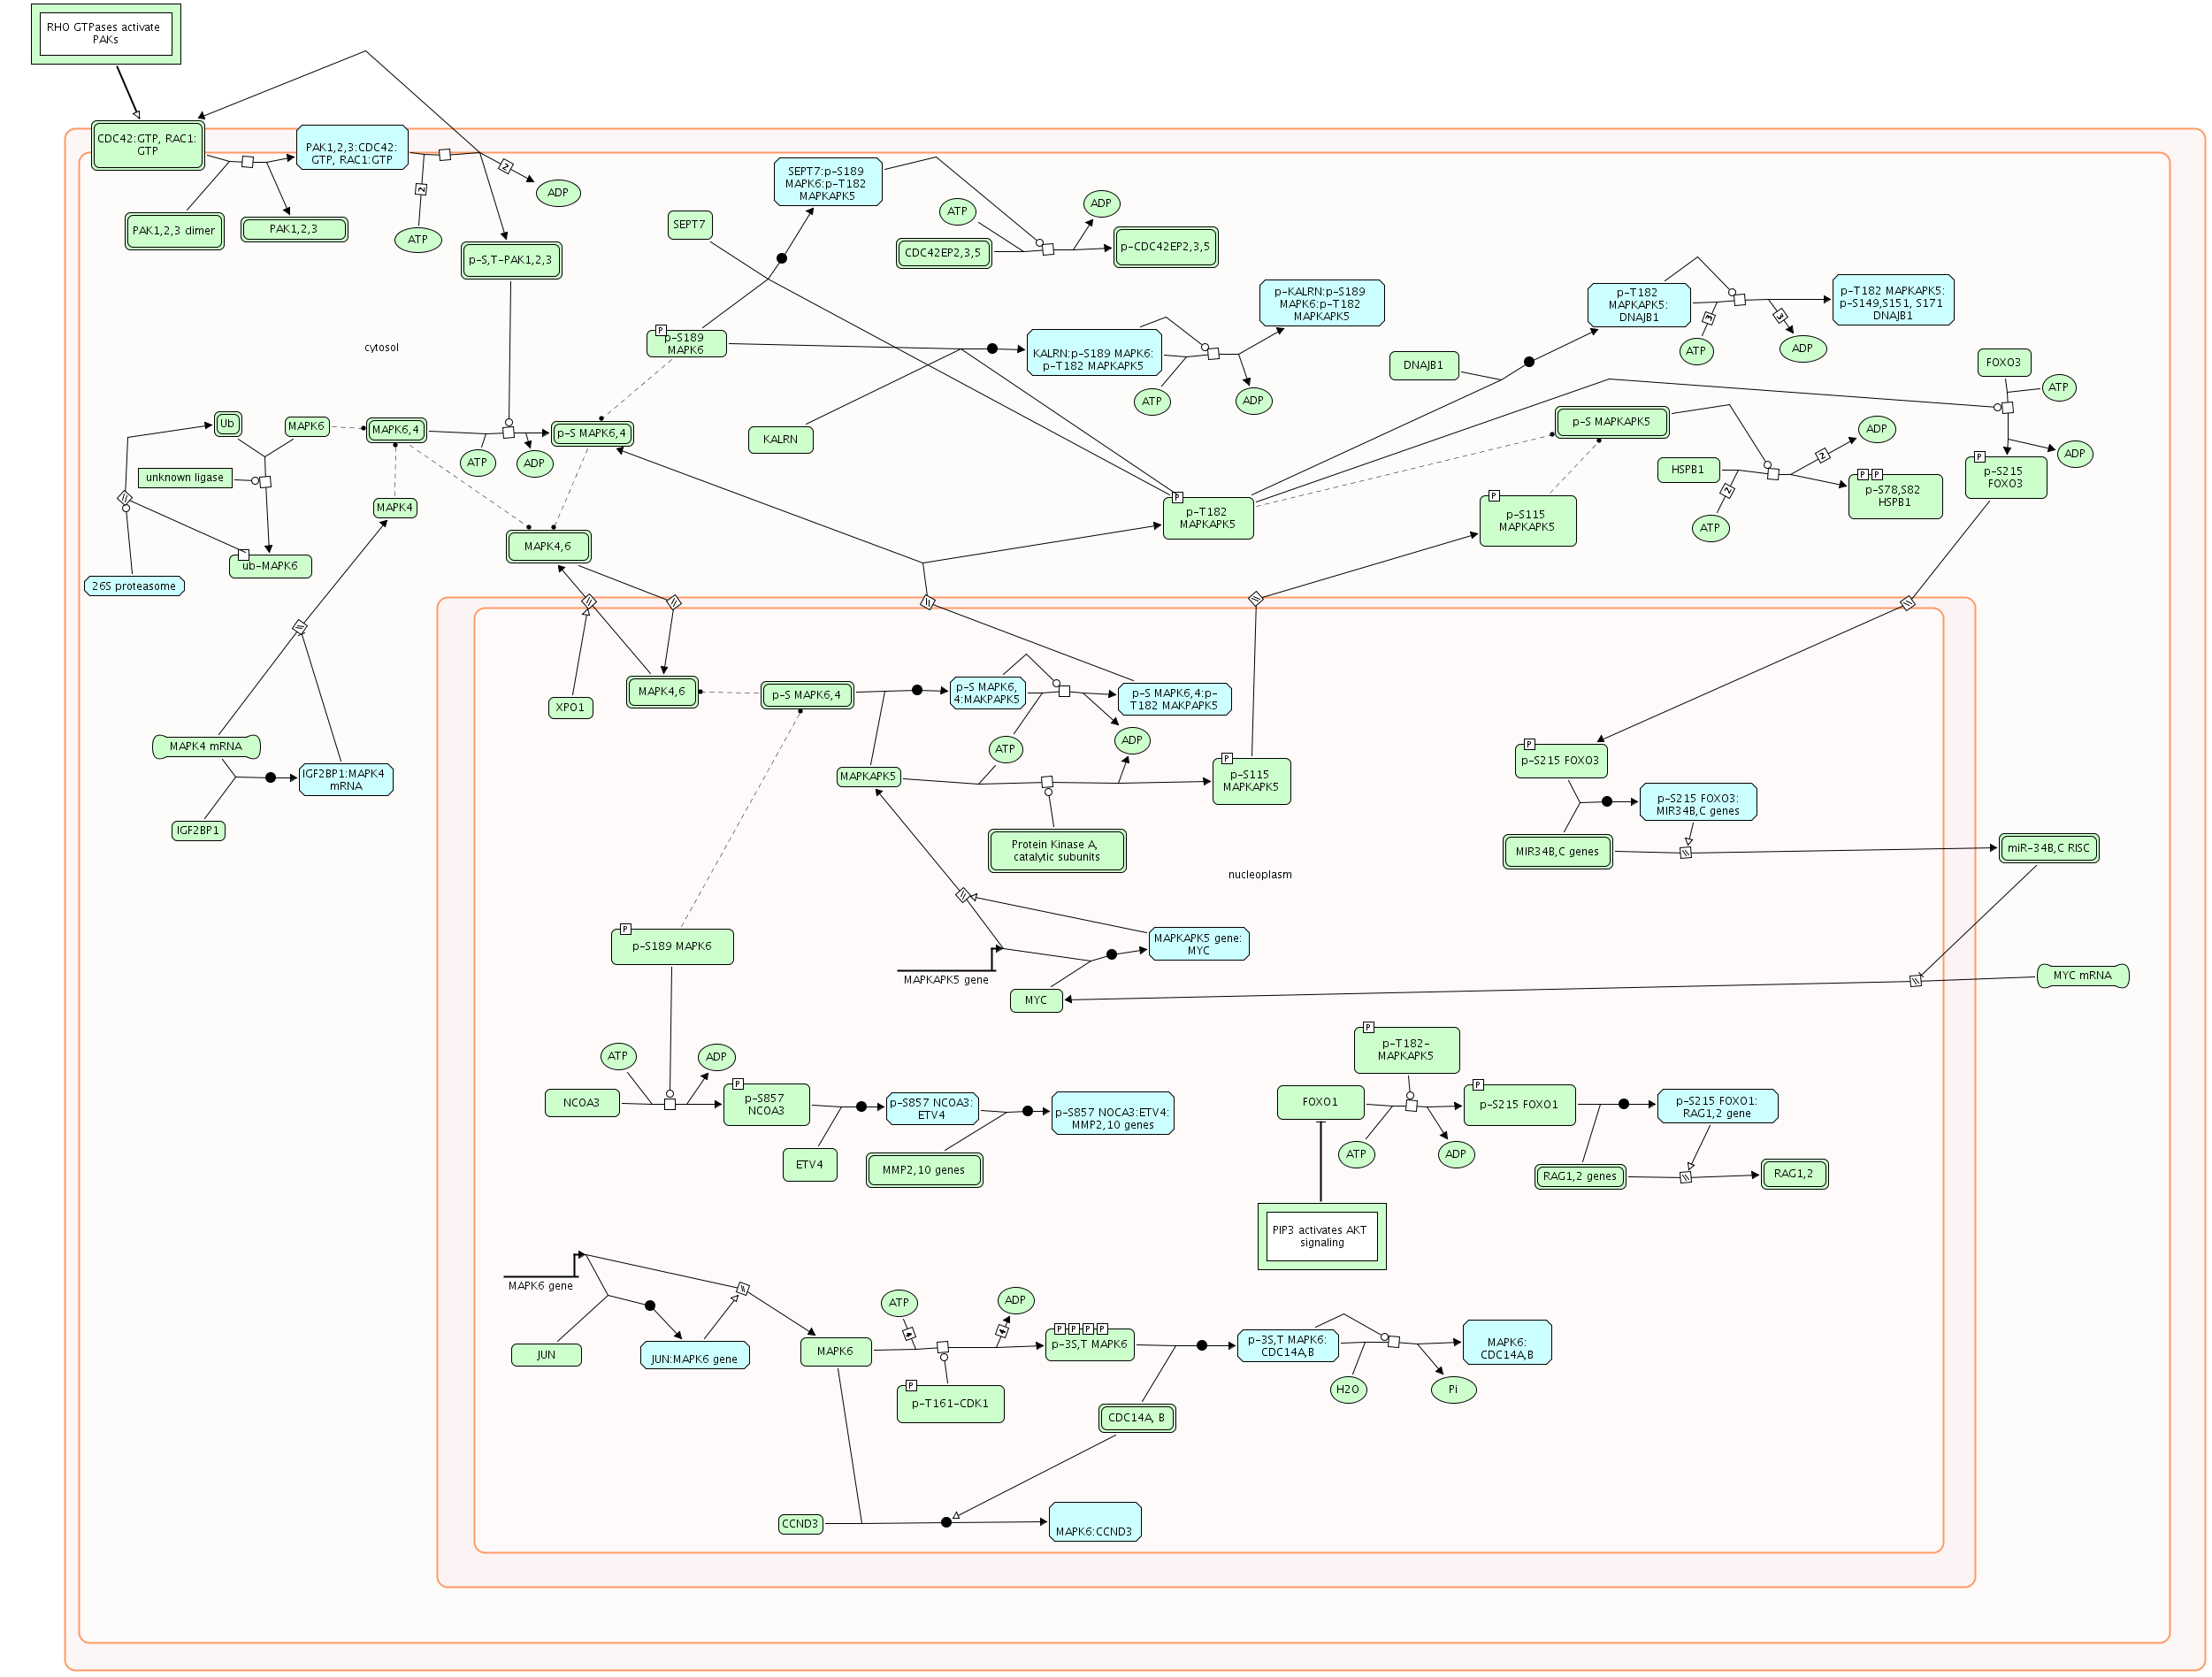
| Diagram of MAPK6-MAPK4 signaling.png | 2025-05-14 17:00 | 276K | |
| Diagram of MAPK1-3 pathway.png | 2025-05-14 17:00 | 2.8K | |
| Diagram of MAP3K8 (TPL2)-dependent MAPK1-3 activation.png | 2025-05-14 16:59 | 72K | |
| Diagram of M-G1 Transition.png | 2025-05-14 16:59 | 83K | |
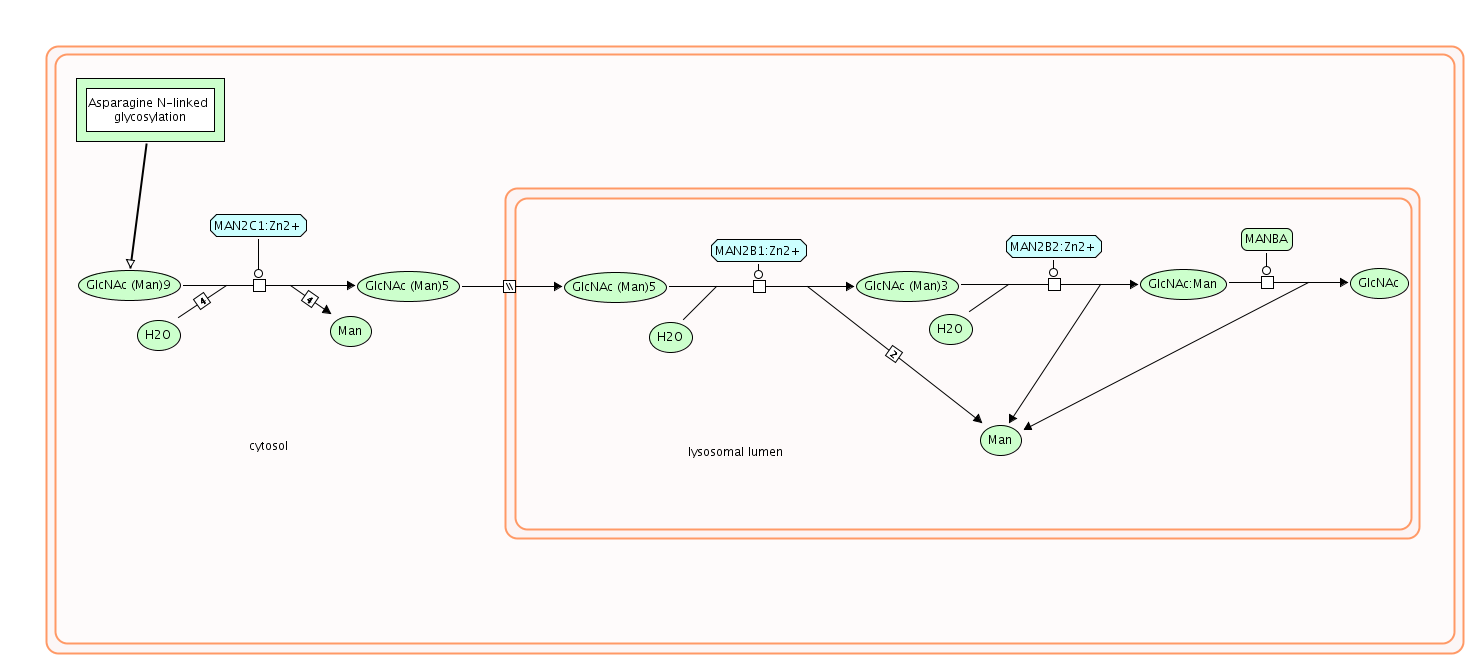
| Diagram of Lysosomal oligosaccharide catabolism.png | 2025-05-14 16:57 | 35K | |
| Diagram of Loss of Function of TGFBR2 in Cancer.png | 2025-05-14 16:57 | 3.2K | |
| Diagram of Loss of Function of TGFBR1 in Cancer.png | 2025-05-14 16:57 | 2.7K | |
| Diagram of Loss of Function of SMAD4 in Cancer.png | 2025-05-14 16:56 | 1.6K | |
| Diagram of Loss of Function of SMAD2-3 in Cancer.png | 2025-05-14 16:57 | 3.5K | |
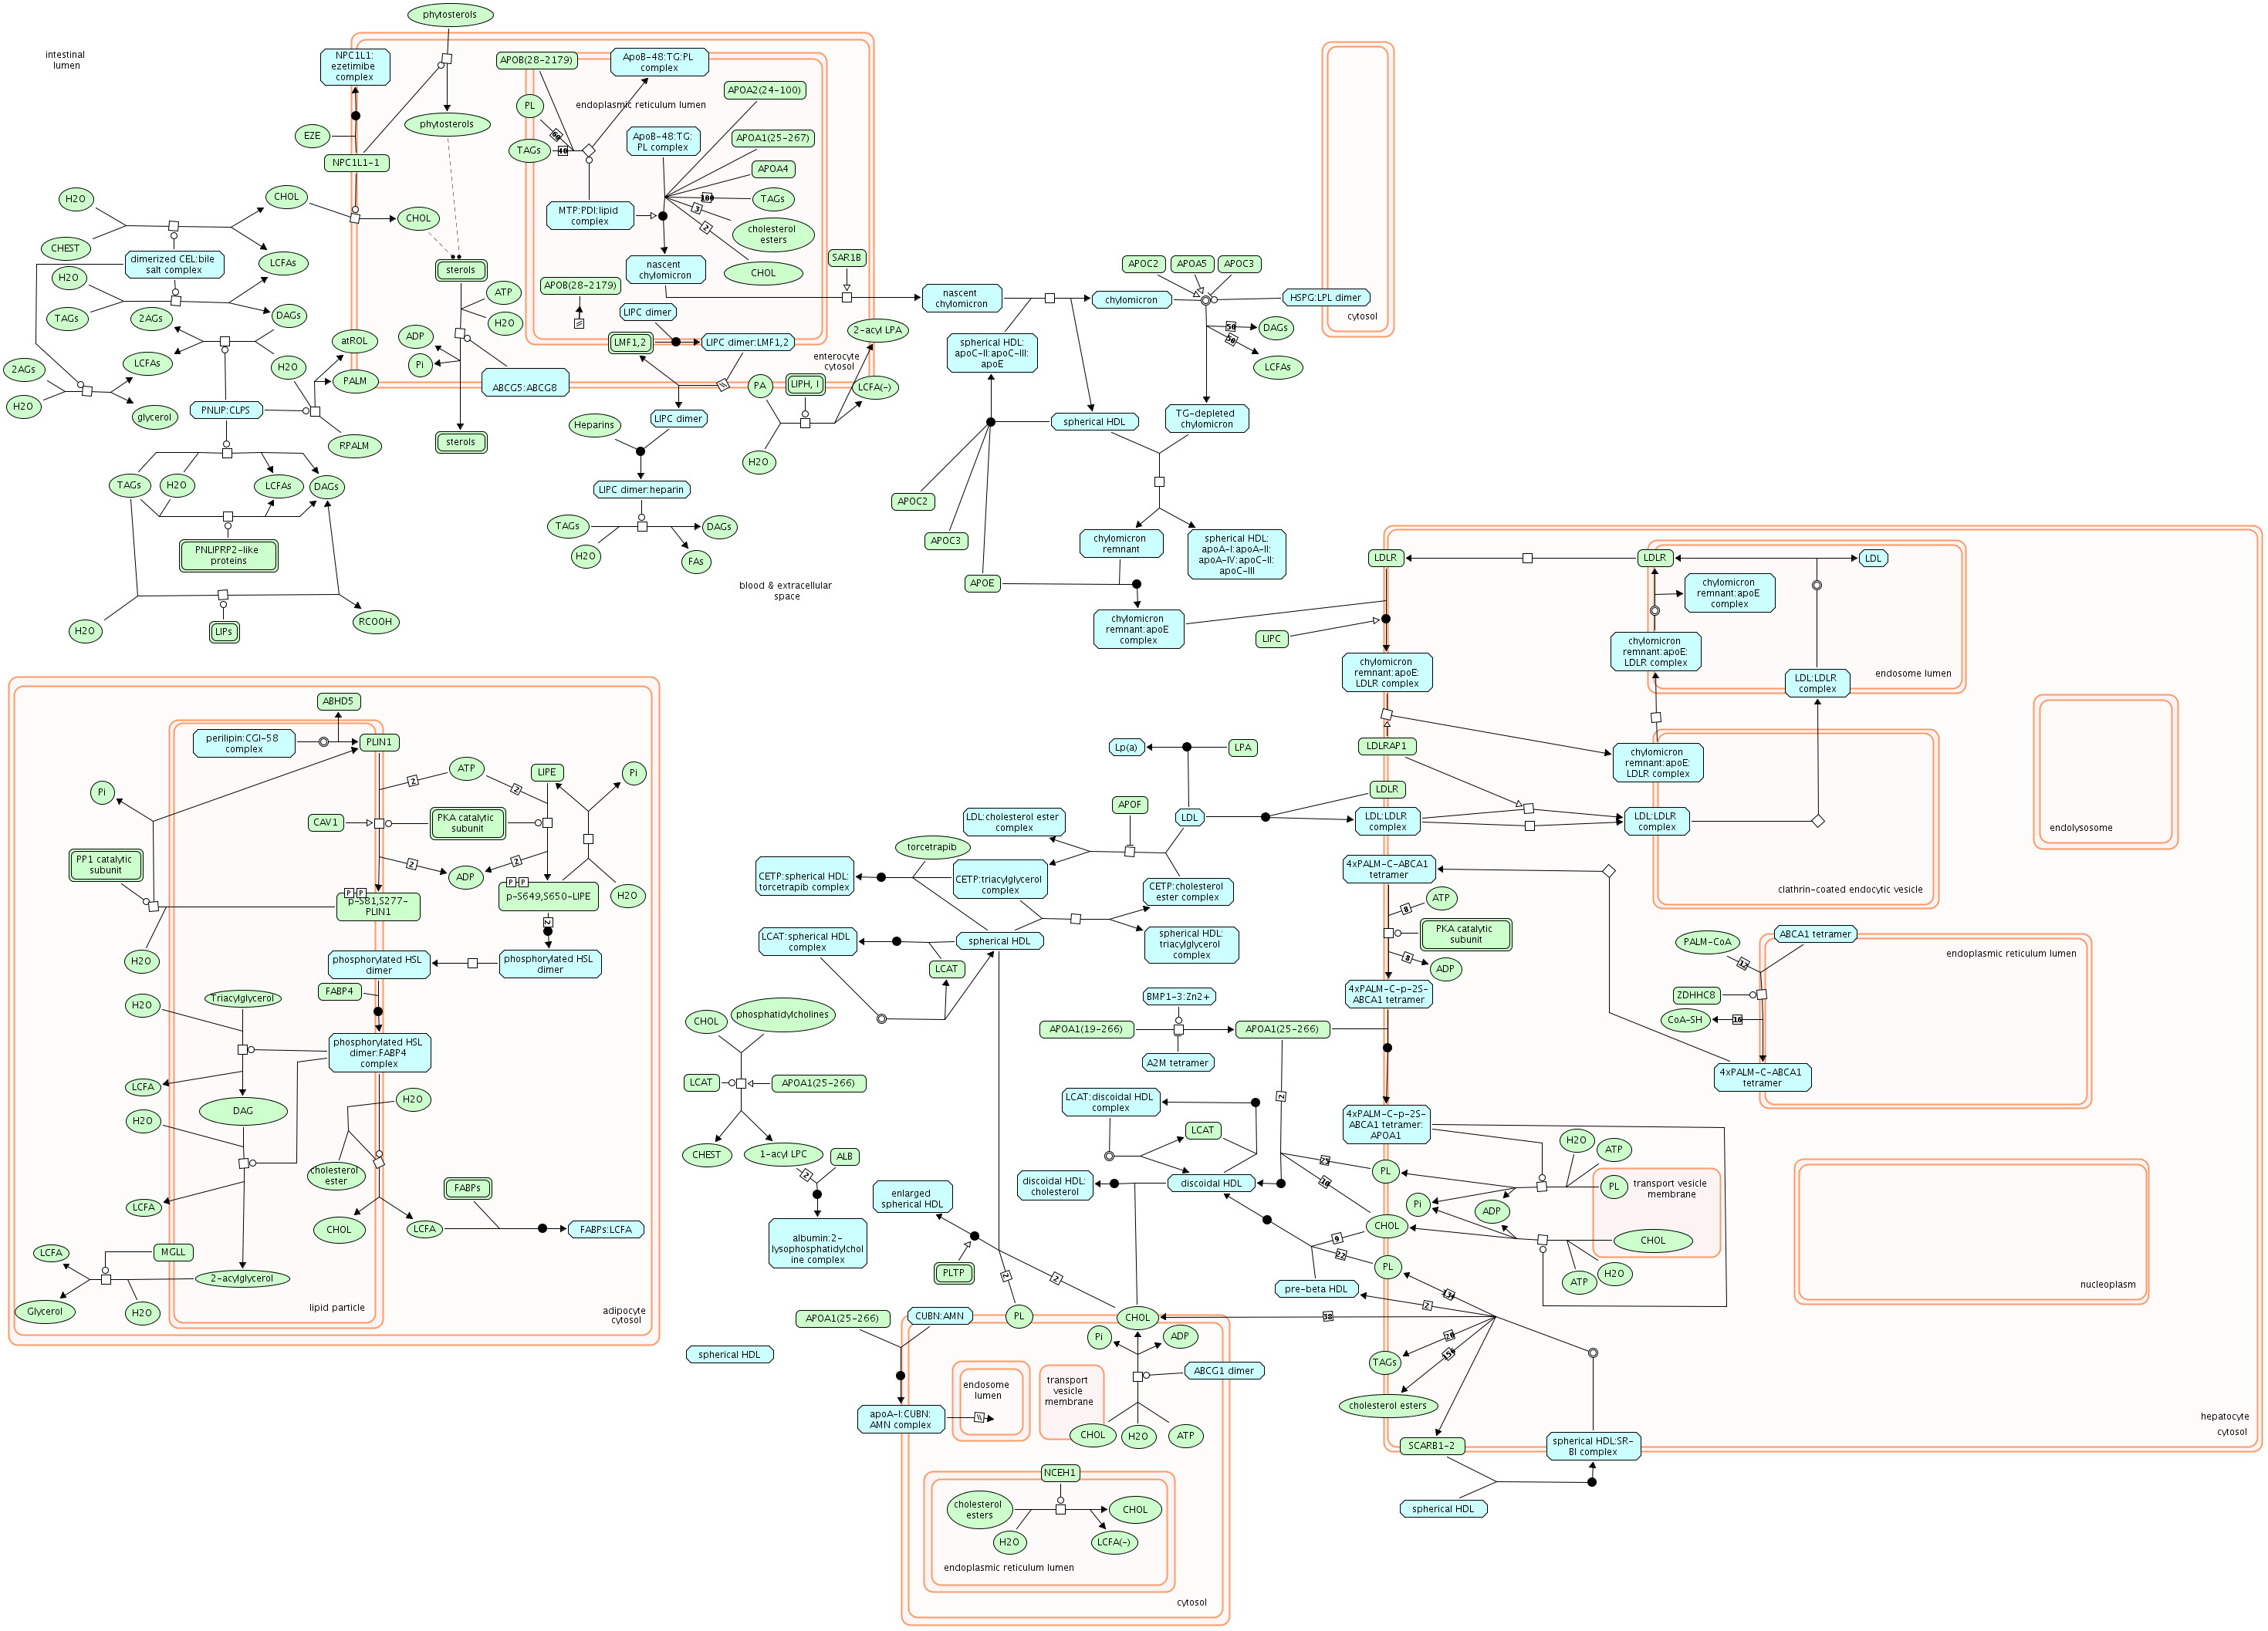
| Diagram of Lipid digestion.png | 2025-05-14 16:59 | 493K | |
| Diagram of Lipid digestion, mobilization, and transport and Defective ABCA1 causes Tangier disease.png | 2025-05-14 16:56 | 493K | |
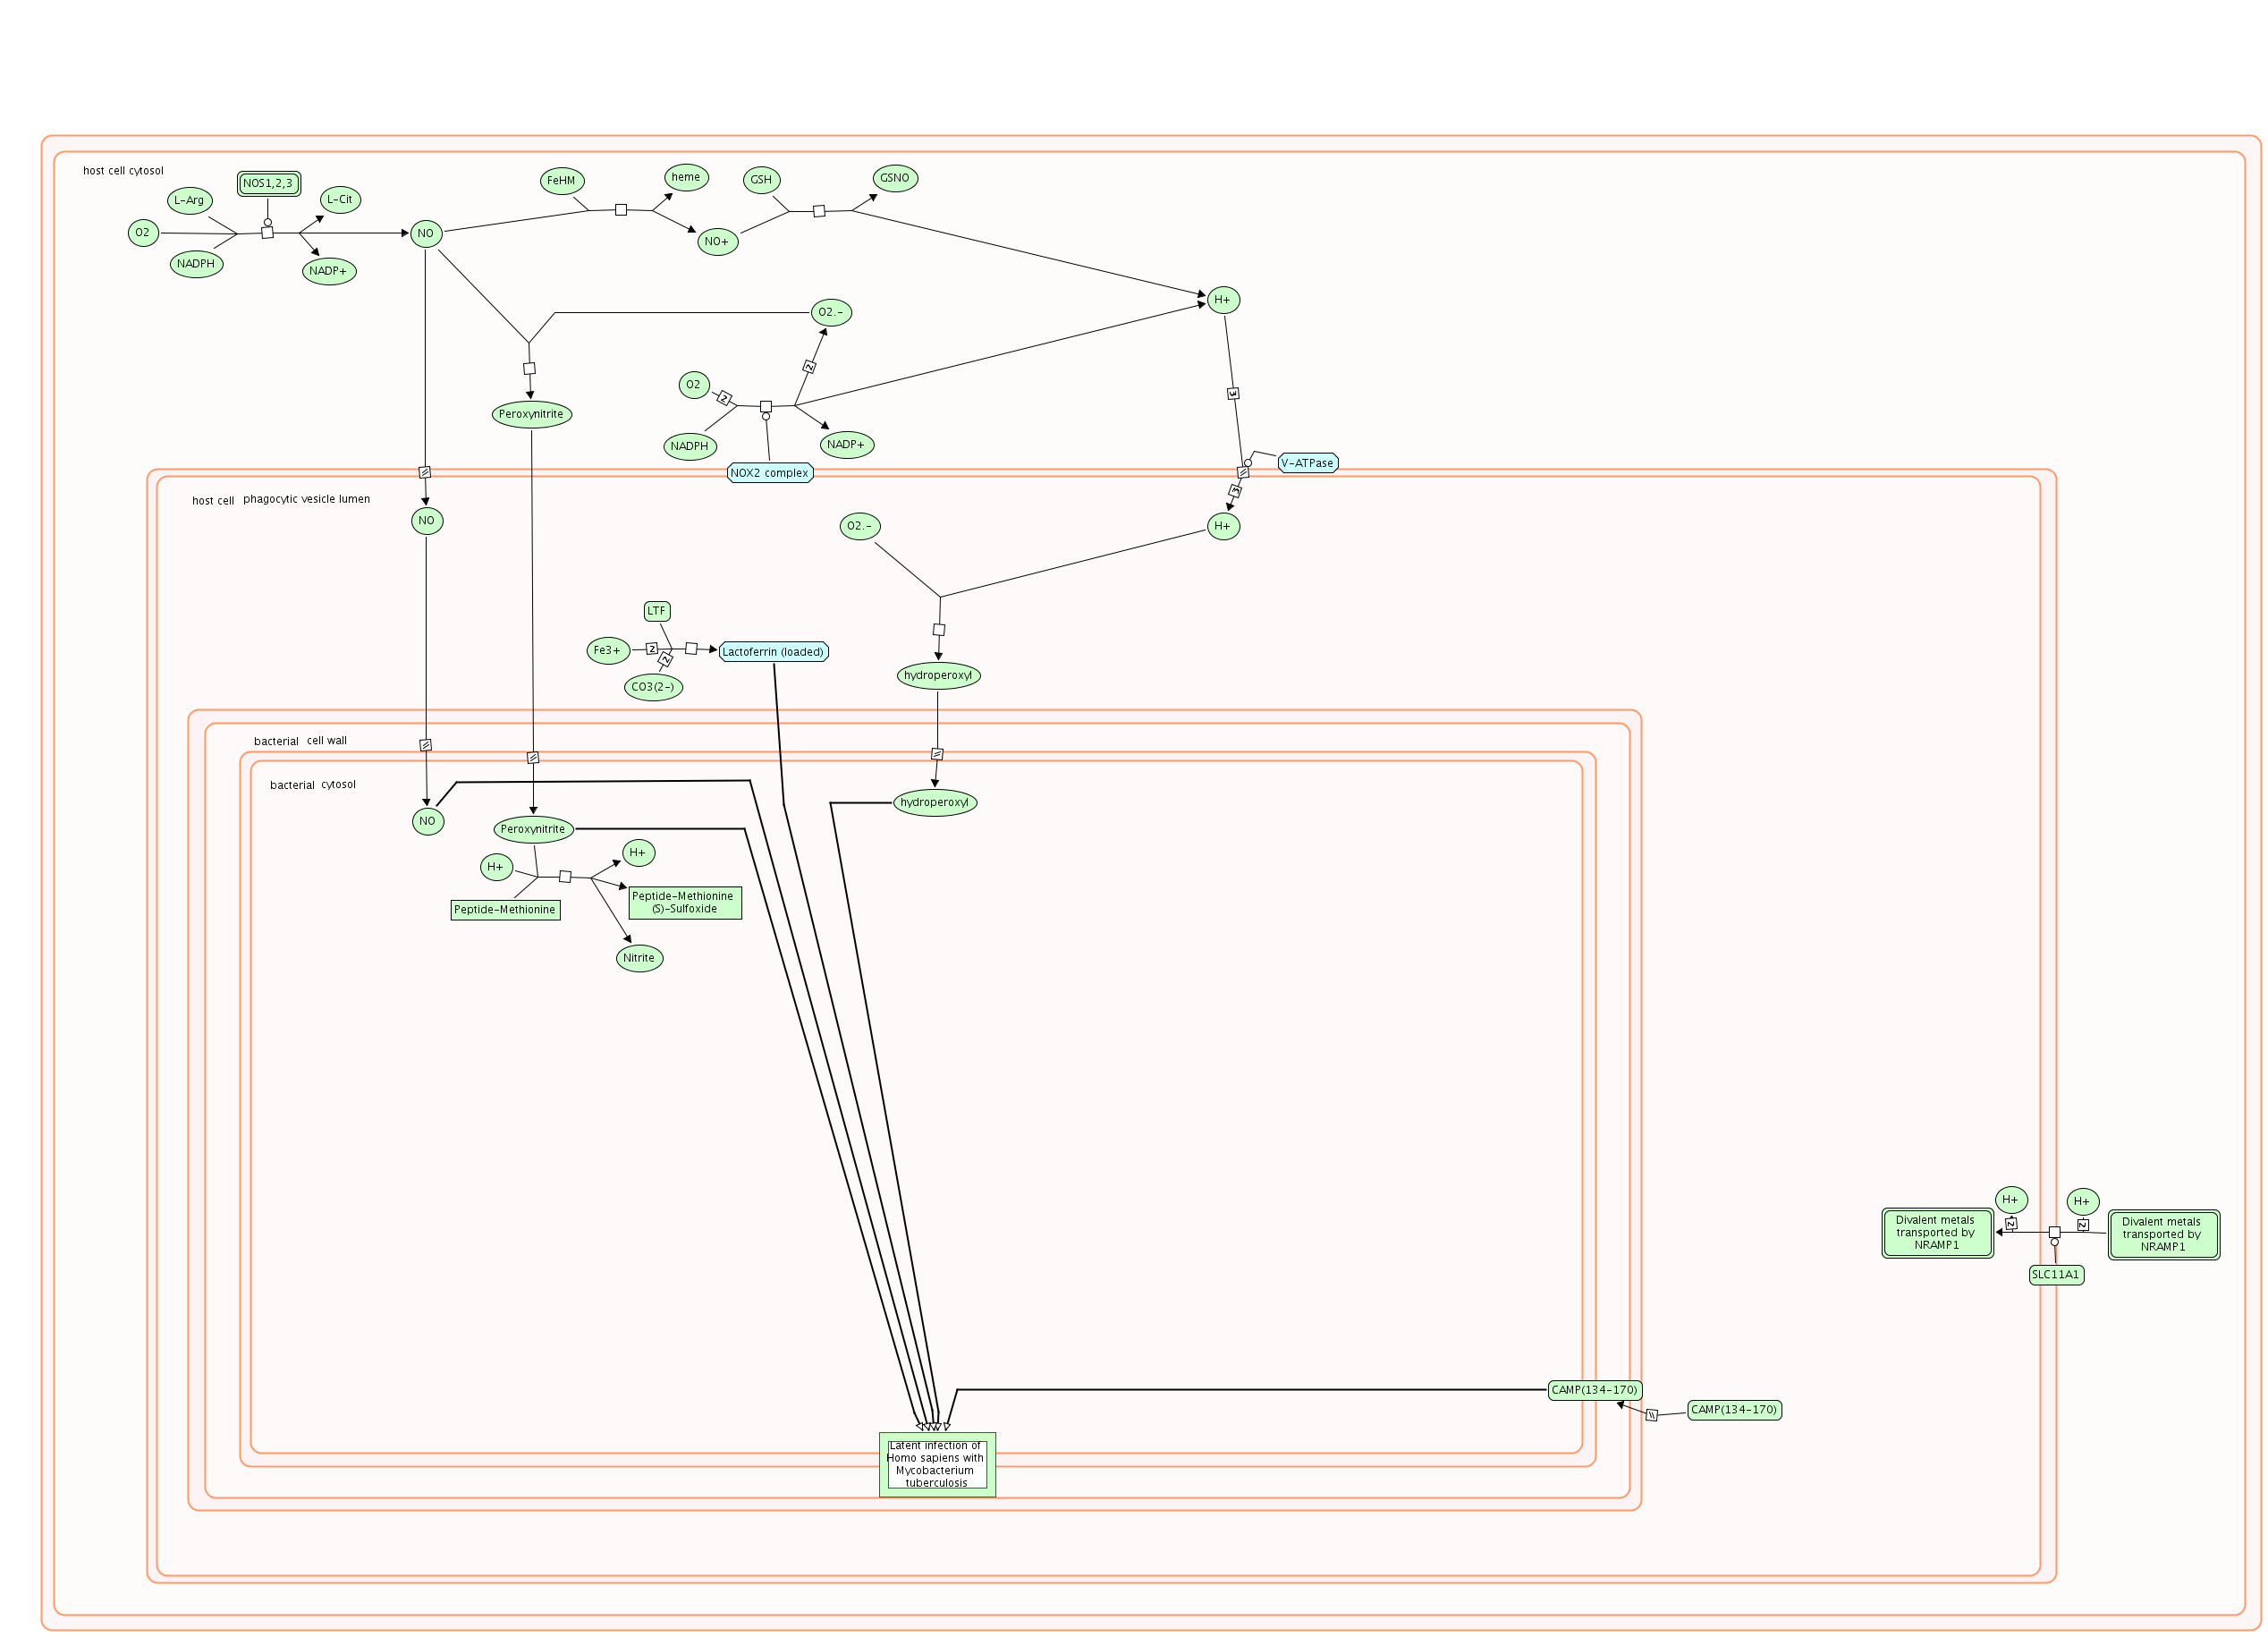
| Diagram of Latent infection of Homo sapiens with Mycobacterium tuberculosis.png | 2025-05-14 16:57 | 268K | |
| Diagram of LGI-ADAM interactions.png | 2025-05-14 16:58 | 24K | |
| Diagram of L1CAM interactions.png | 2025-05-14 16:57 | 315K | |
| Diagram of Kinesins.png | 2025-05-14 16:57 | 48K | |
| Diagram of Iron uptake transport.png | 2025-05-14 16:59 | 427K | |
| Diagram of Iron uptake and transport, Ion channel transport, Defective CP causes aceruloplasminemia (ACERULOP), Defective SLC11A2 causes hypochromic microcytic anemia, with iron overload 1 (AHMIO1), Defective SLC40A1 causes hemochromatosis 4 (HFE4) (m.png | 2025-05-14 16:55 | 427K | |
| Diagram of Ion channel transport.png | 2025-05-14 16:57 | 427K | |
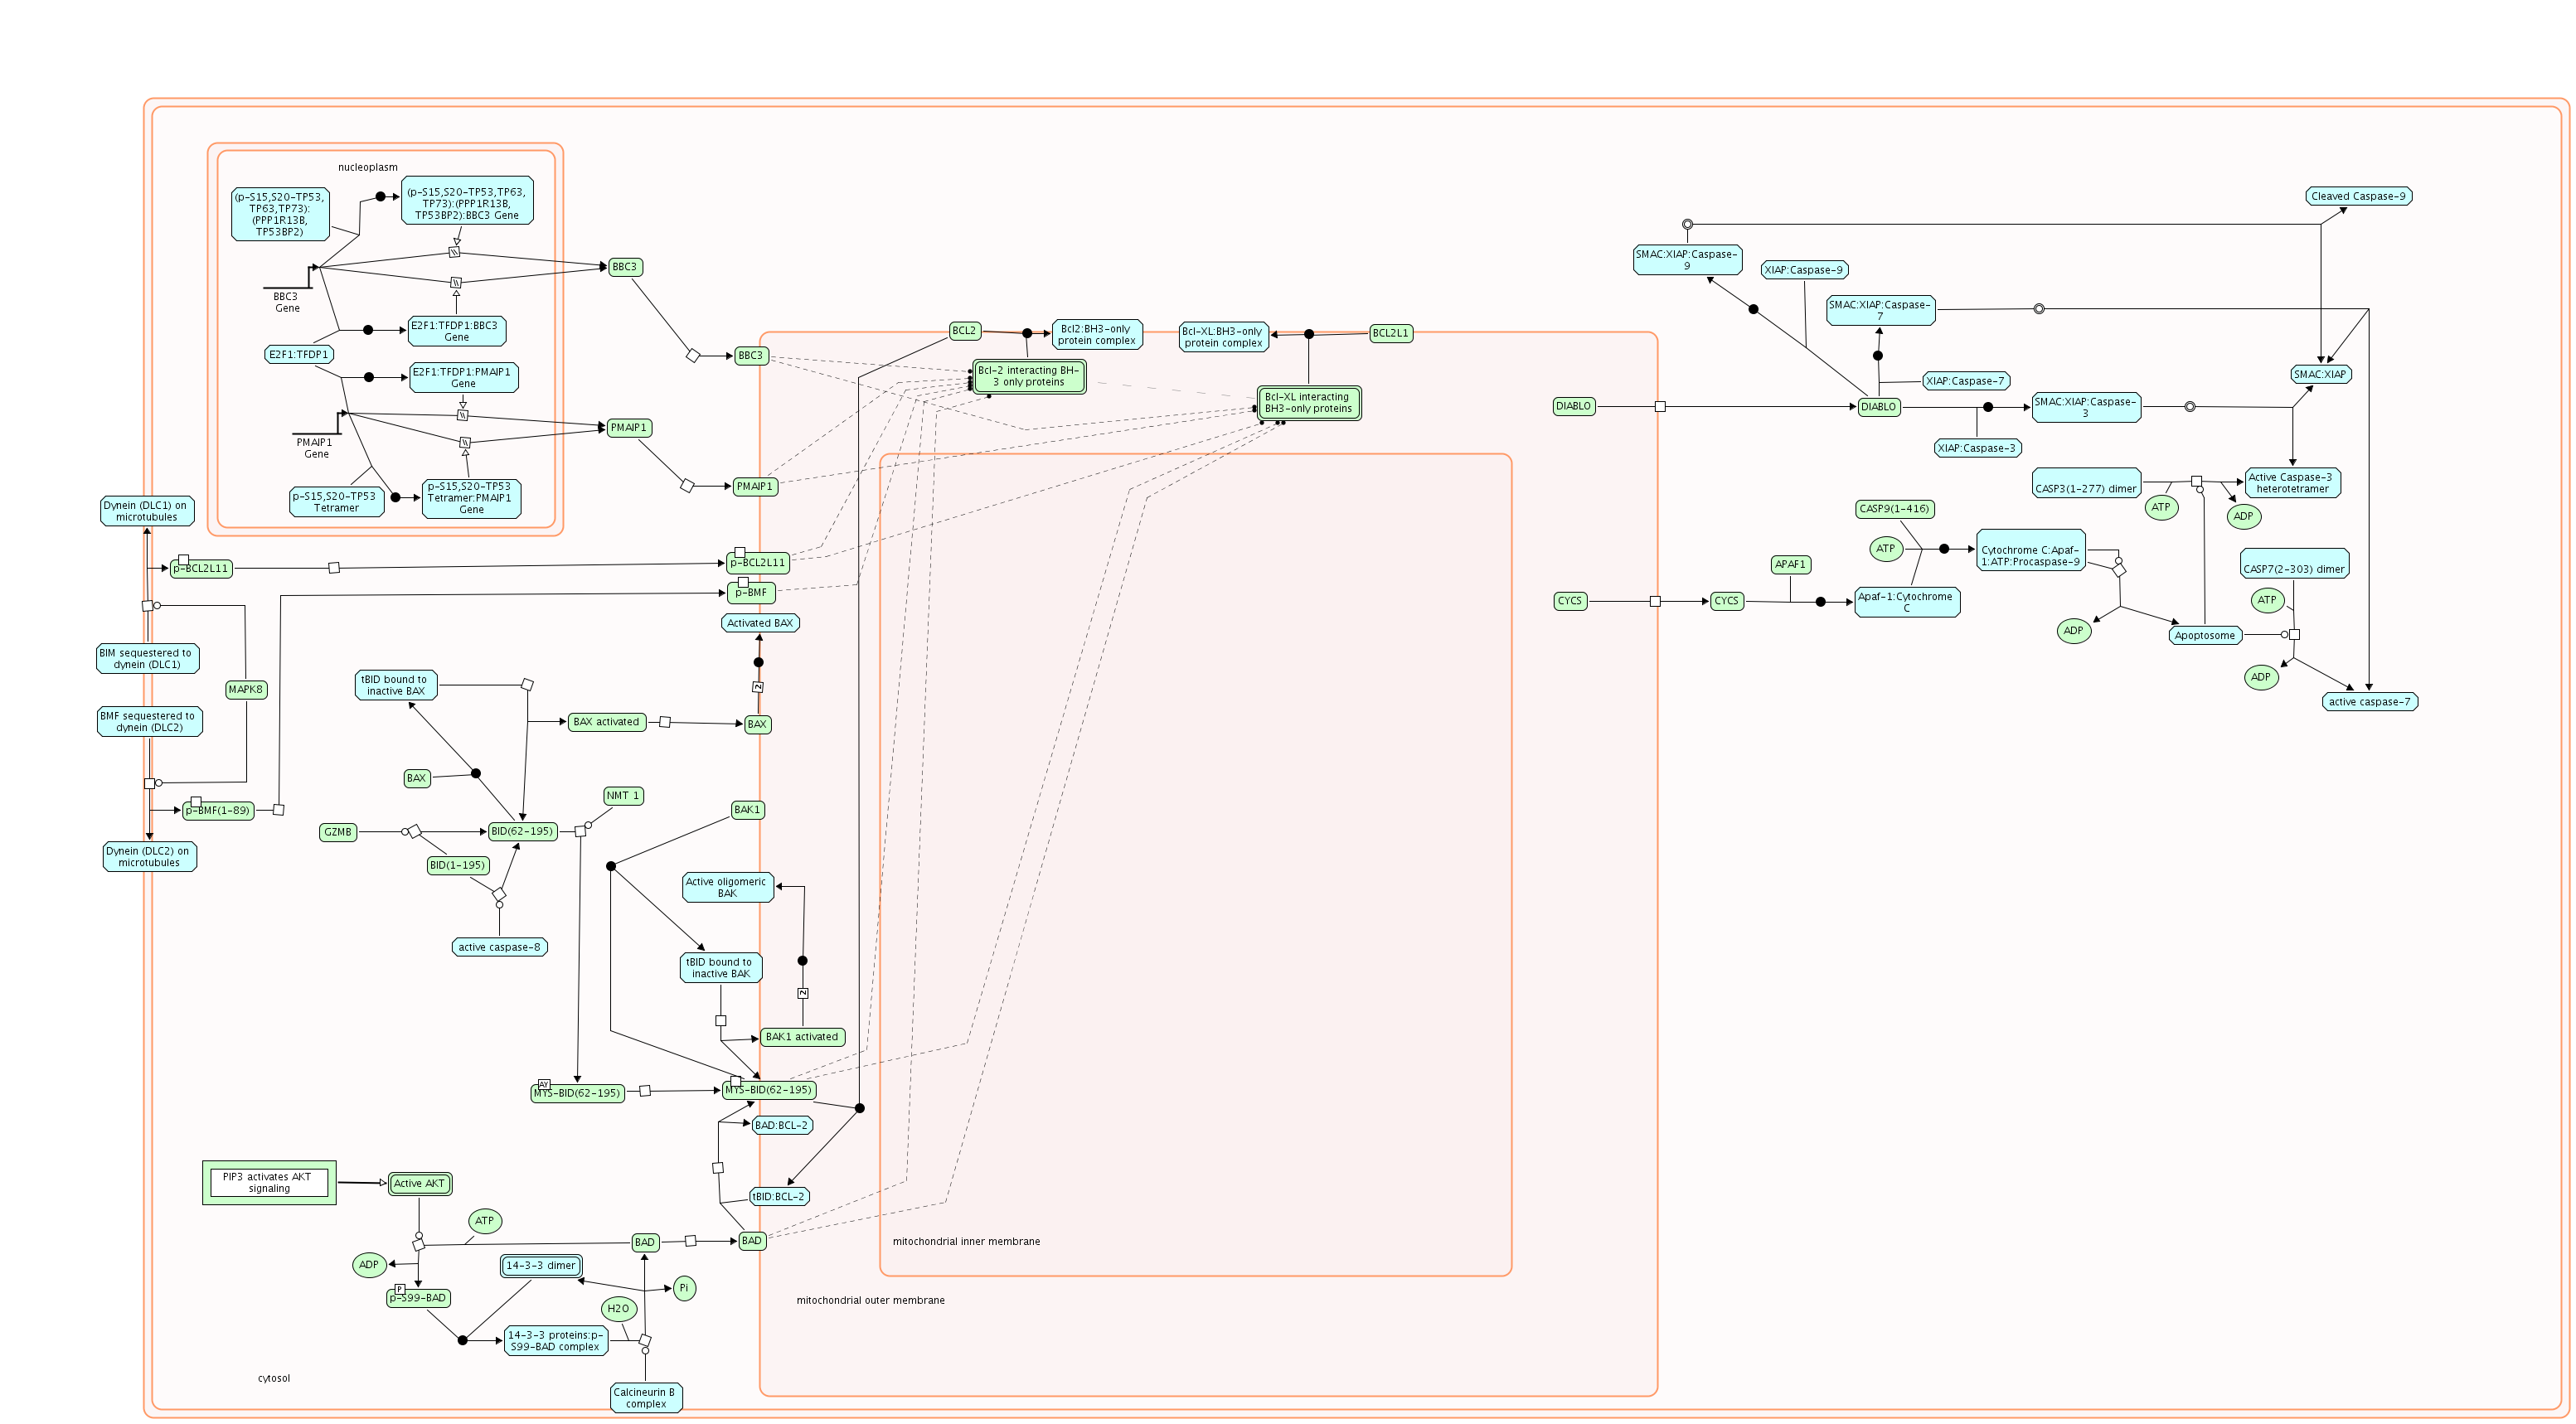
| Diagram of Intrinsic Pathway for Apoptosis.png | 2025-05-14 16:55 | 246K | |
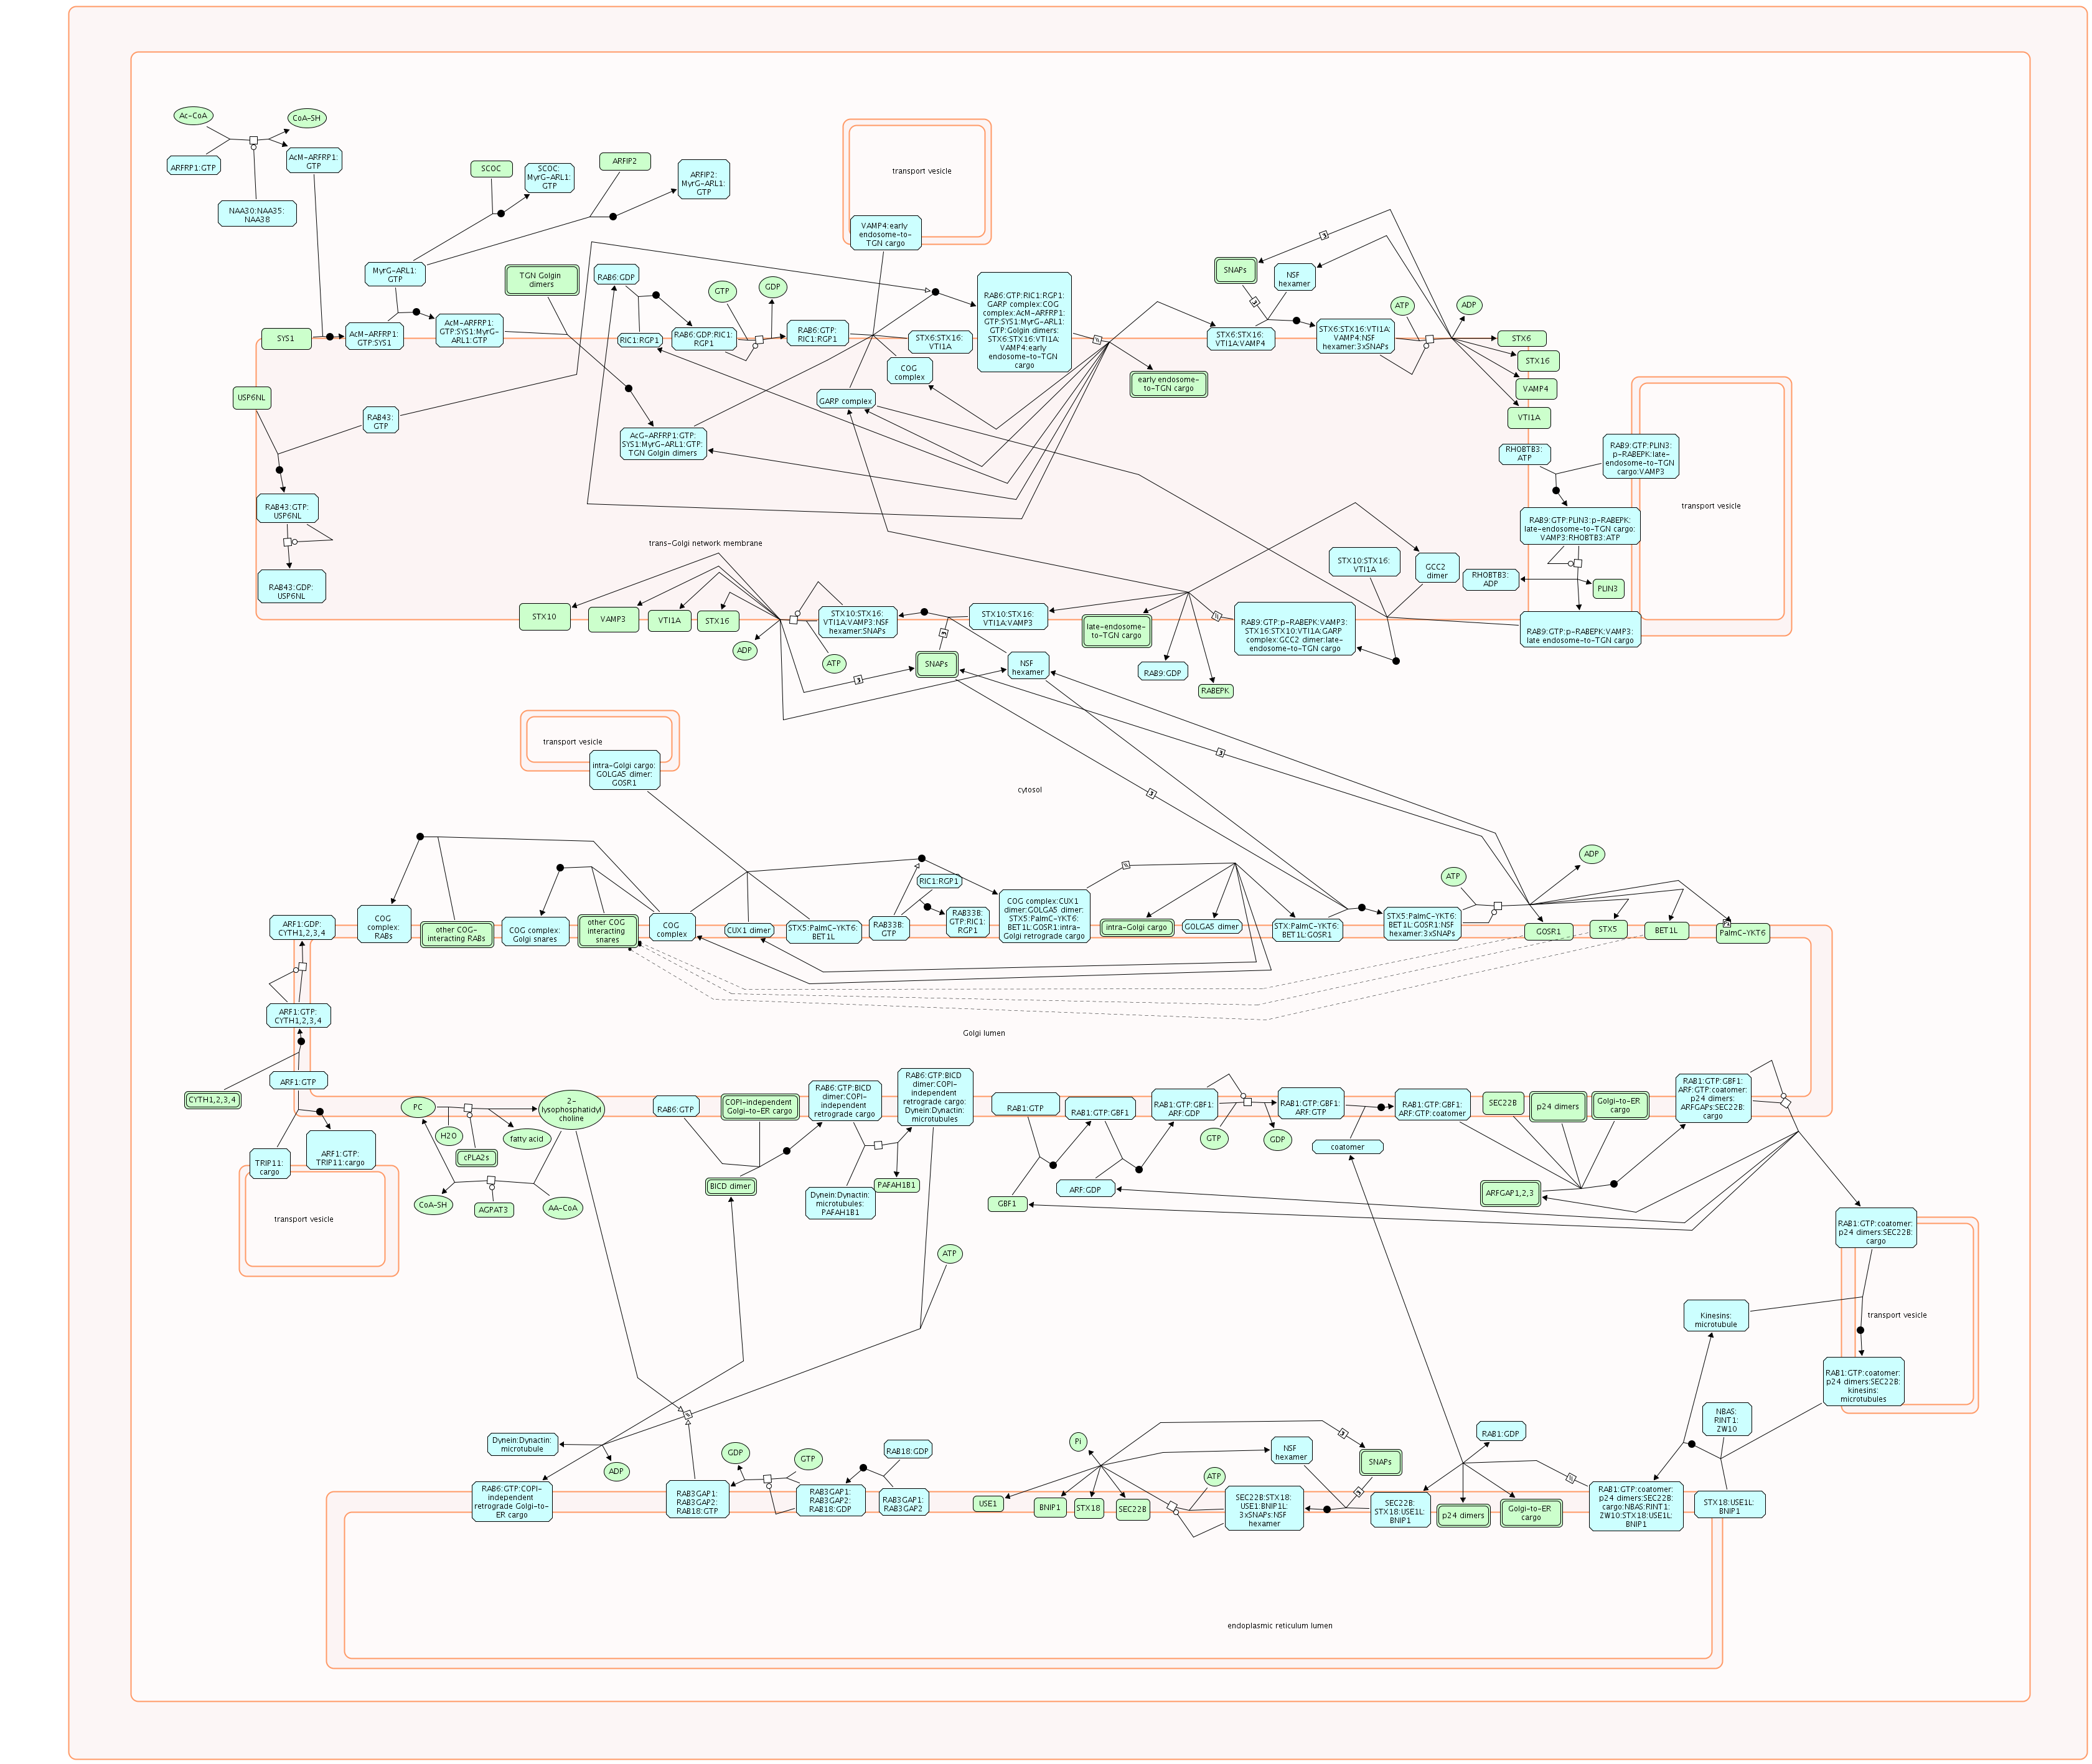
| Diagram of Intra-Golgi and retrograde Golgi-to-ER traffic.png | 2025-05-14 16:57 | 572K | |
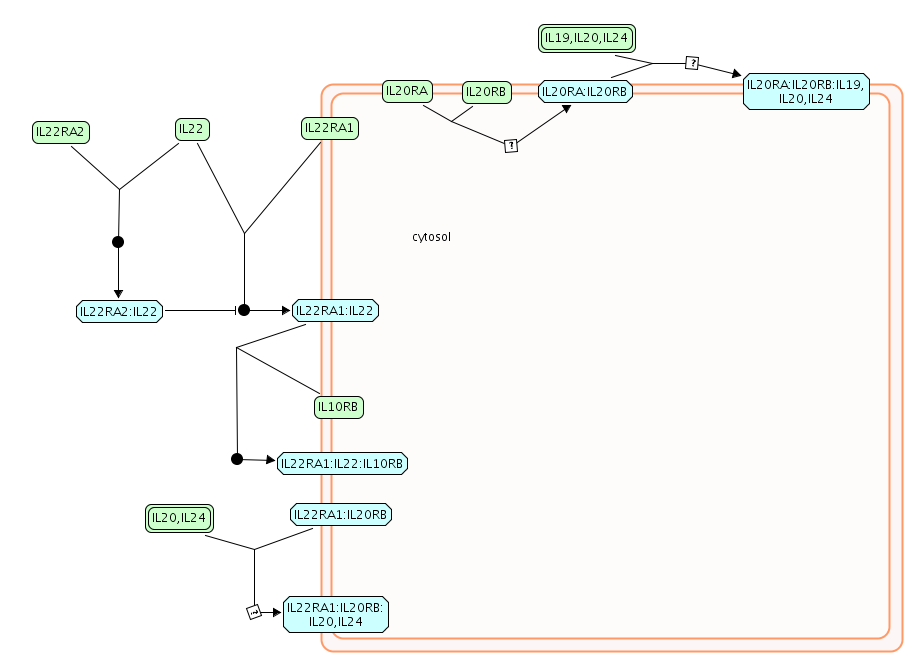
| Diagram of Interleukin-19.png | 2025-05-14 16:58 | 26K | |
| Diagram of Interleukin-19, 20, 22, 24.png | 2025-05-14 16:57 | 26K | |
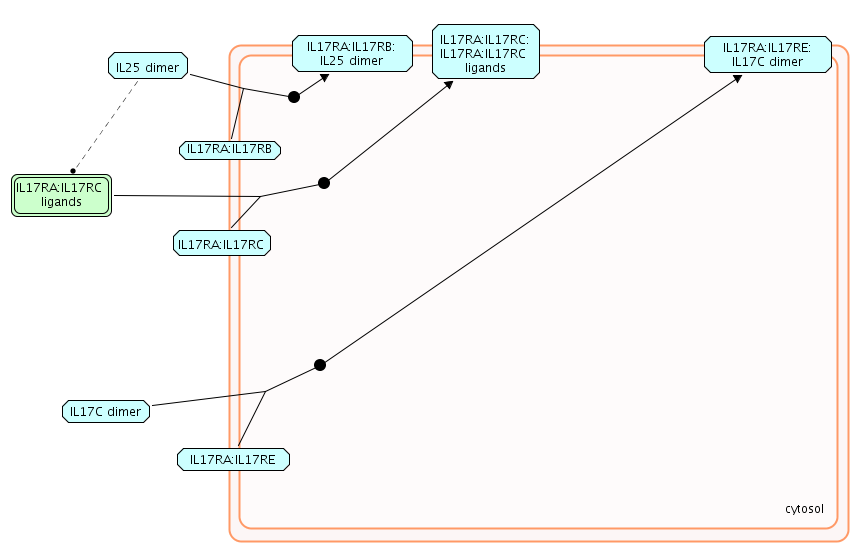
| Diagram of Interleukin-17 signaling.png | 2025-05-14 17:00 | 23K | |
| Diagram of Interleukin-7 signaling and JAK3 deficiency causes SCID (IL7R).png | 2025-05-14 16:57 | 40K | |
| Diagram of Interleukin-6 signaling.png | 2025-05-14 17:00 | 97K | |
| Diagram of Interleukin-6 family signaling.png | 2025-05-14 16:56 | 2.4K | |
| Diagram of Interleukin-3.png | 2025-05-14 17:00 | 320K | |
| Diagram of Interleukin-3, 5 and GM-CSF signaling.png | 2025-05-14 16:57 | 320K | |
| Diagram of Interleukin-2 signaling and JAK3 deficiency (IL2).png | 2025-05-14 17:00 | 141K | |
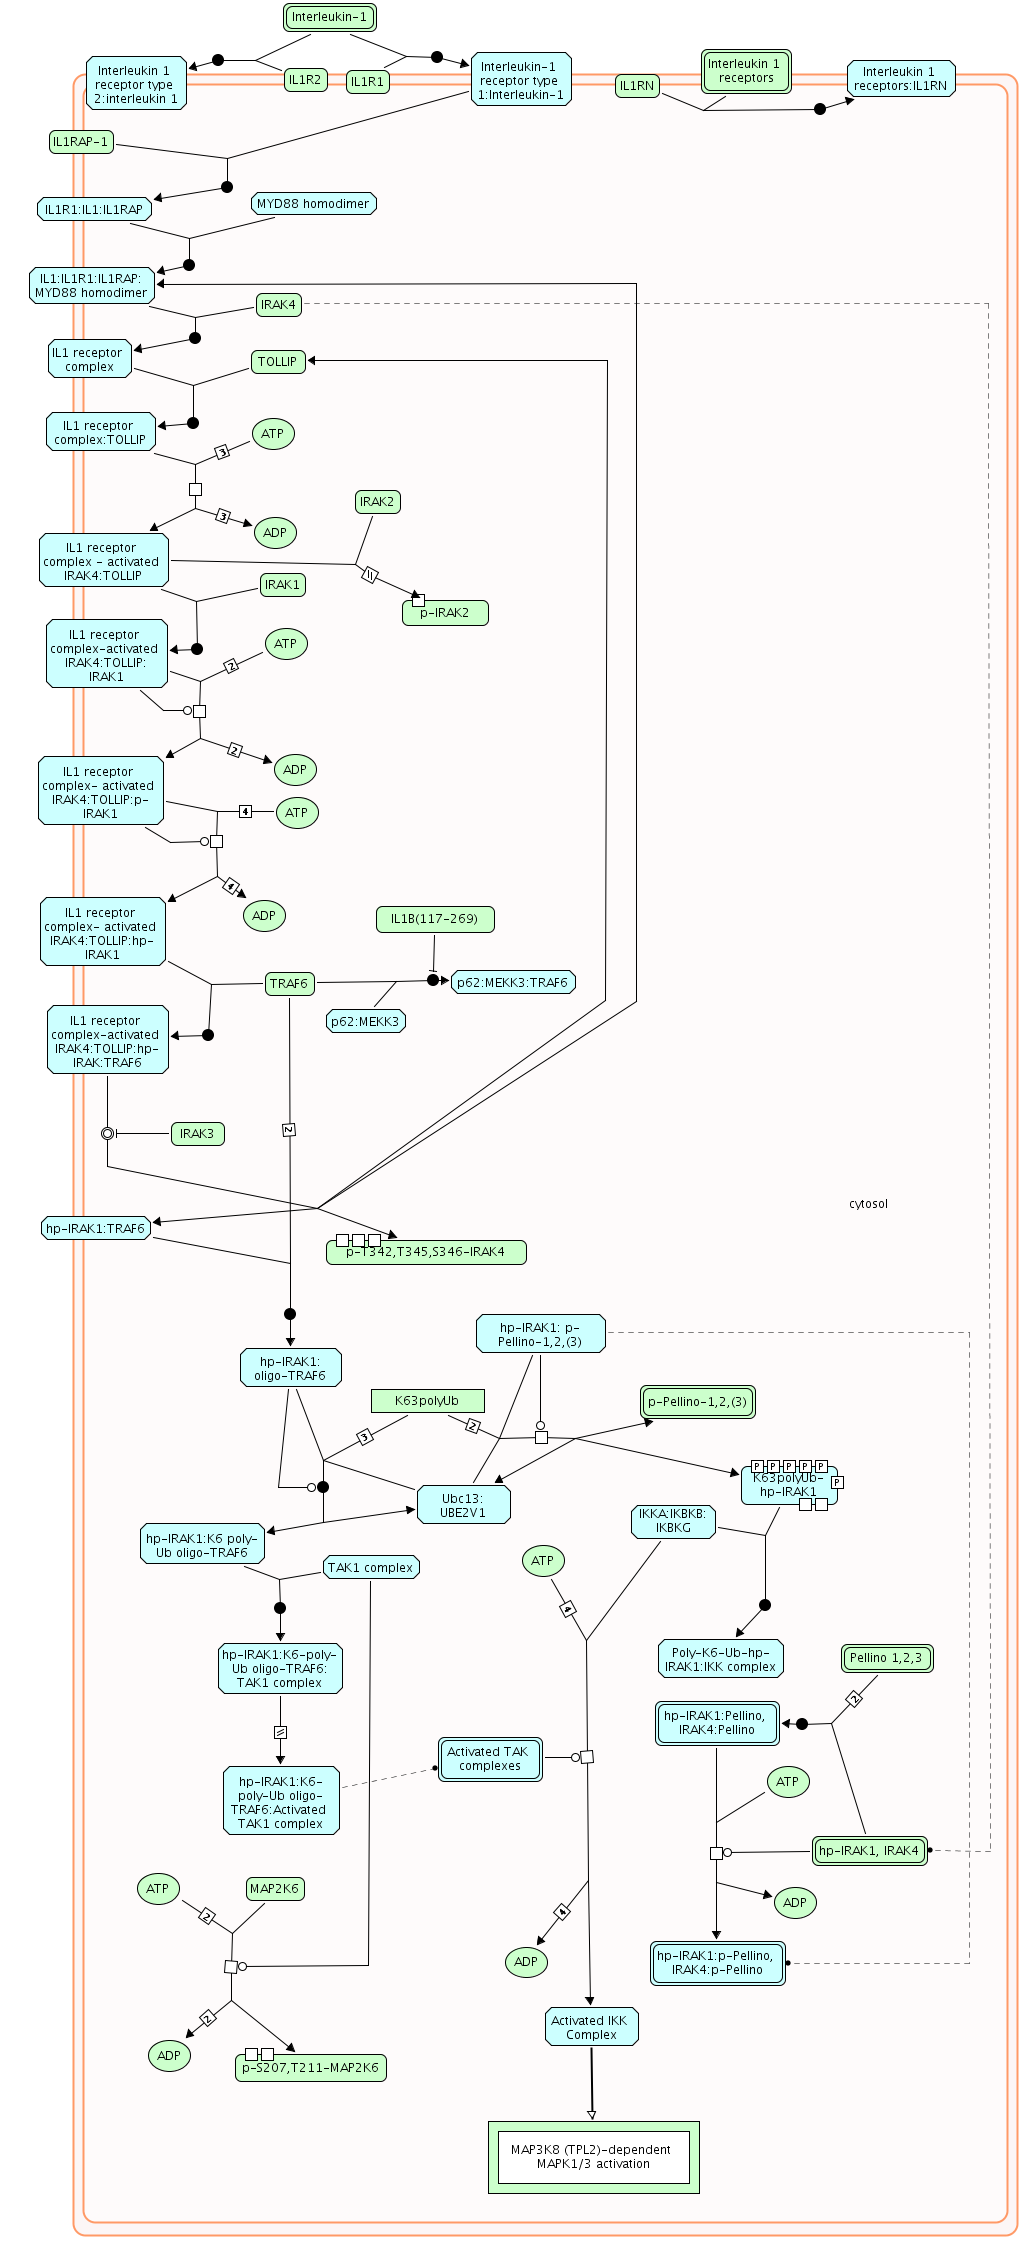
| Diagram of Interleukin-1 signaling.png | 2025-05-14 16:59 | 172K | |
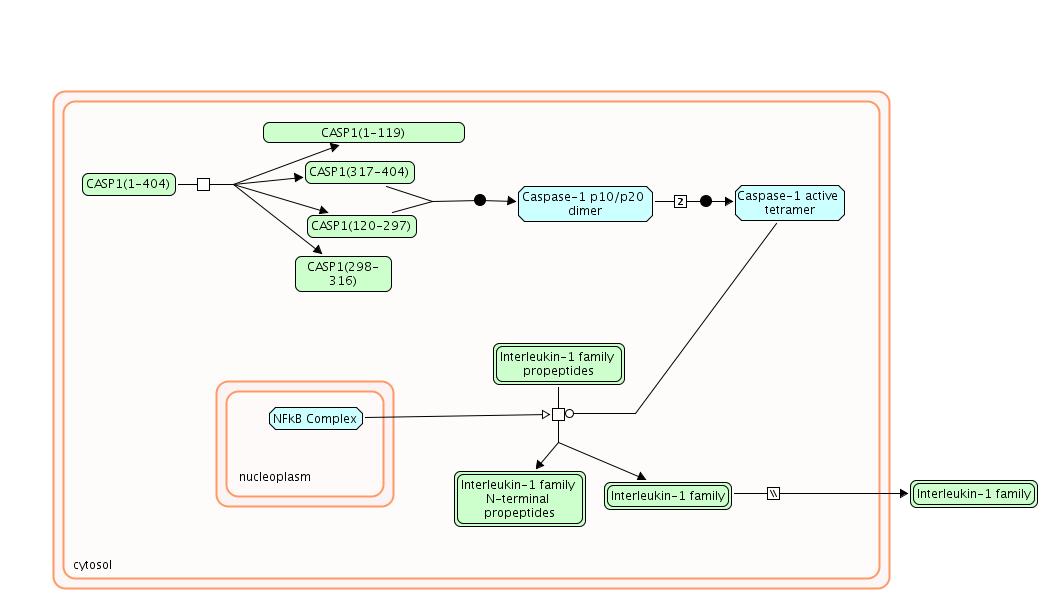
| Diagram of Interleukin-1 processing.png | 2025-05-14 16:59 | 32K | |
| Diagram of Interferon gamma signaling.png | 2025-05-14 16:57 | 126K | |
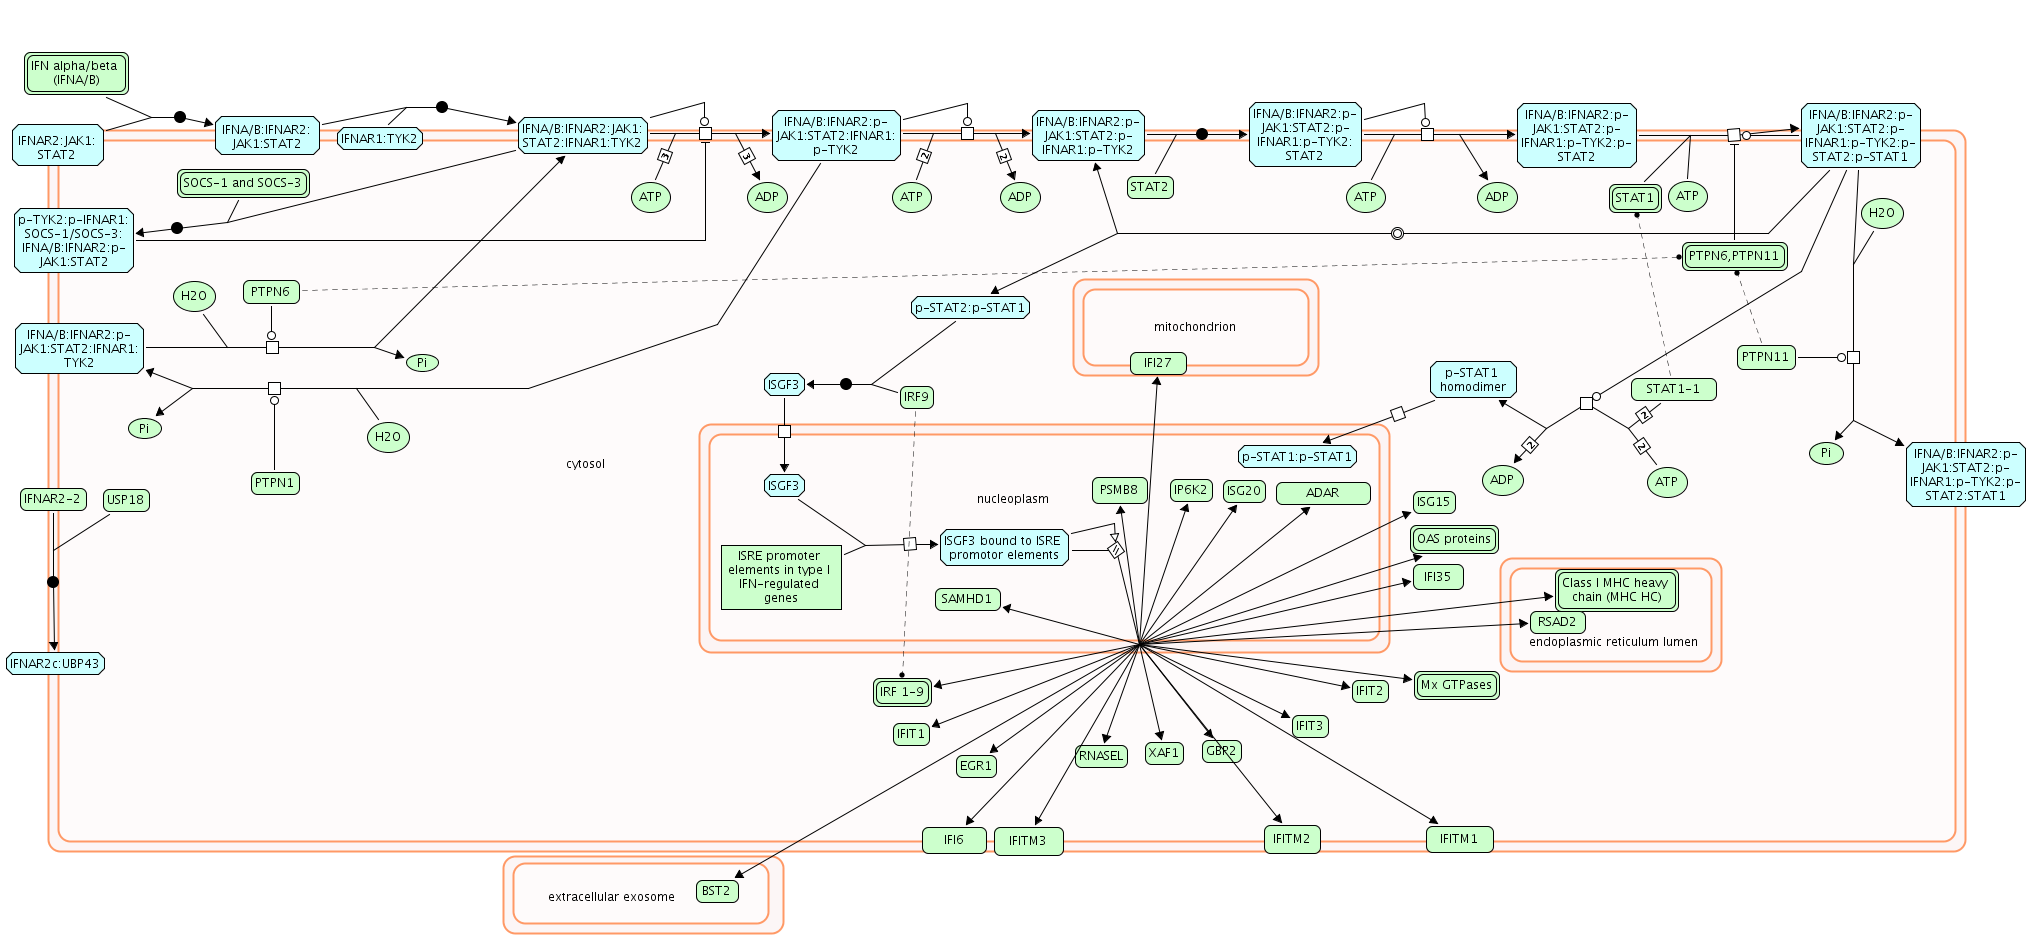
| Diagram of Interferon alpha-beta signaling.png | 2025-05-14 16:55 | 160K | |
| Diagram of Interferon Signaling.png | 2025-05-14 16:57 | 6.0K | |
| Diagram of Integrin cell surface interactions.png | 2025-05-14 16:55 | 256K | |
| Diagram of Integrin alphaIIb beta3 signaling.png | 2025-05-14 16:59 | 148K | |
| Diagram of Integration of energy metabolism and Defective ABCC8 can cause hypoglycemias and hyperglycemias.png | 2025-05-14 16:56 | 464K | |
| Diagram of Insulin processing.png | 2025-05-14 17:00 | 91K | |
| Diagram of Insulin-like Growth Factor-2 mRNA Binding Proteins (IGF2BPs-IMPs-VICKZs) bind RNA.png | 2025-05-14 16:57 | 14K | |
| Diagram of Inositol phosphate metabolism.png | 2025-05-14 16:55 | 366K | |
| Diagram of Innate Immunity Signaling.png | 2025-05-14 17:00 | 17K | |
| Diagram of Influenza Life Cycle.png | 2025-05-14 16:56 | 392K | |
| Diagram of Influenza Infection.png | 2025-05-14 16:58 | 2.0K | |
| Diagram of Infectious disease.png | 2025-05-14 16:59 | 4.7K | |
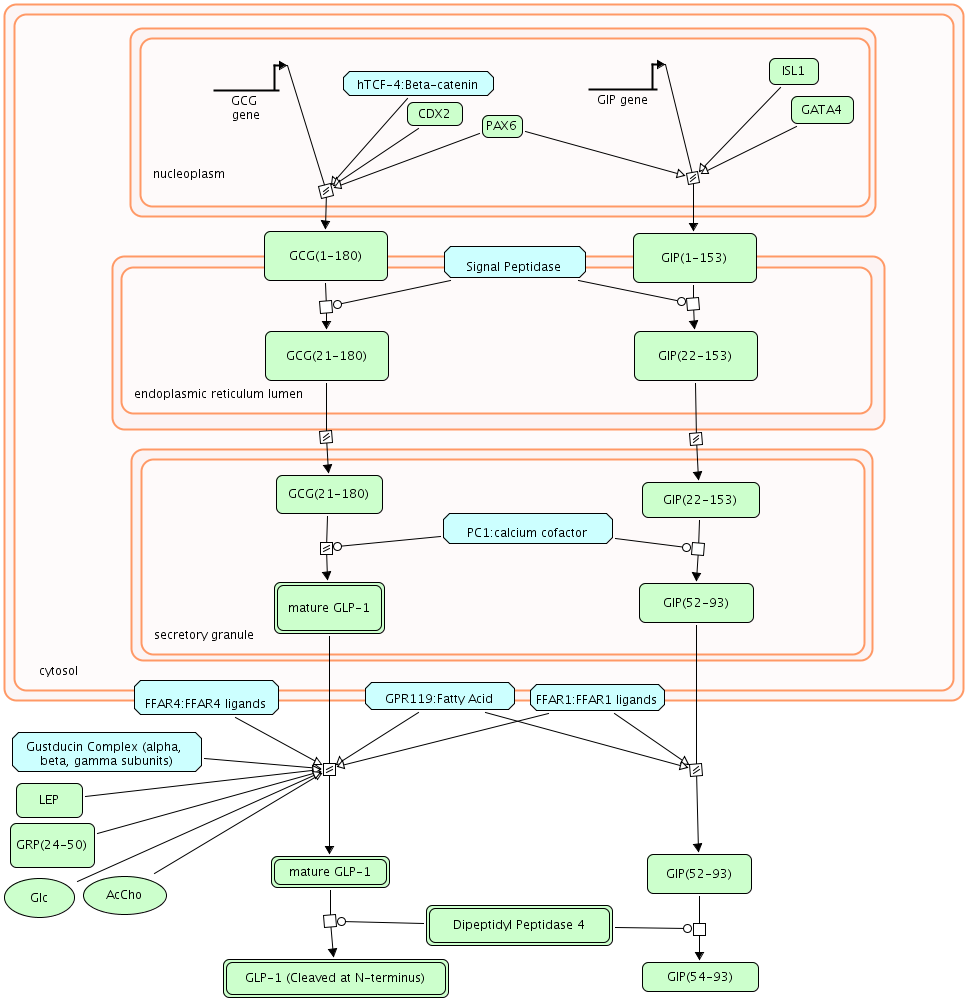
| Diagram of Incretin synthesis.png | 2025-05-14 16:59 | 74K | |
| Diagram of Incretin synthesis, secretion, and inactivation.png | 2025-05-14 16:57 | 74K | |
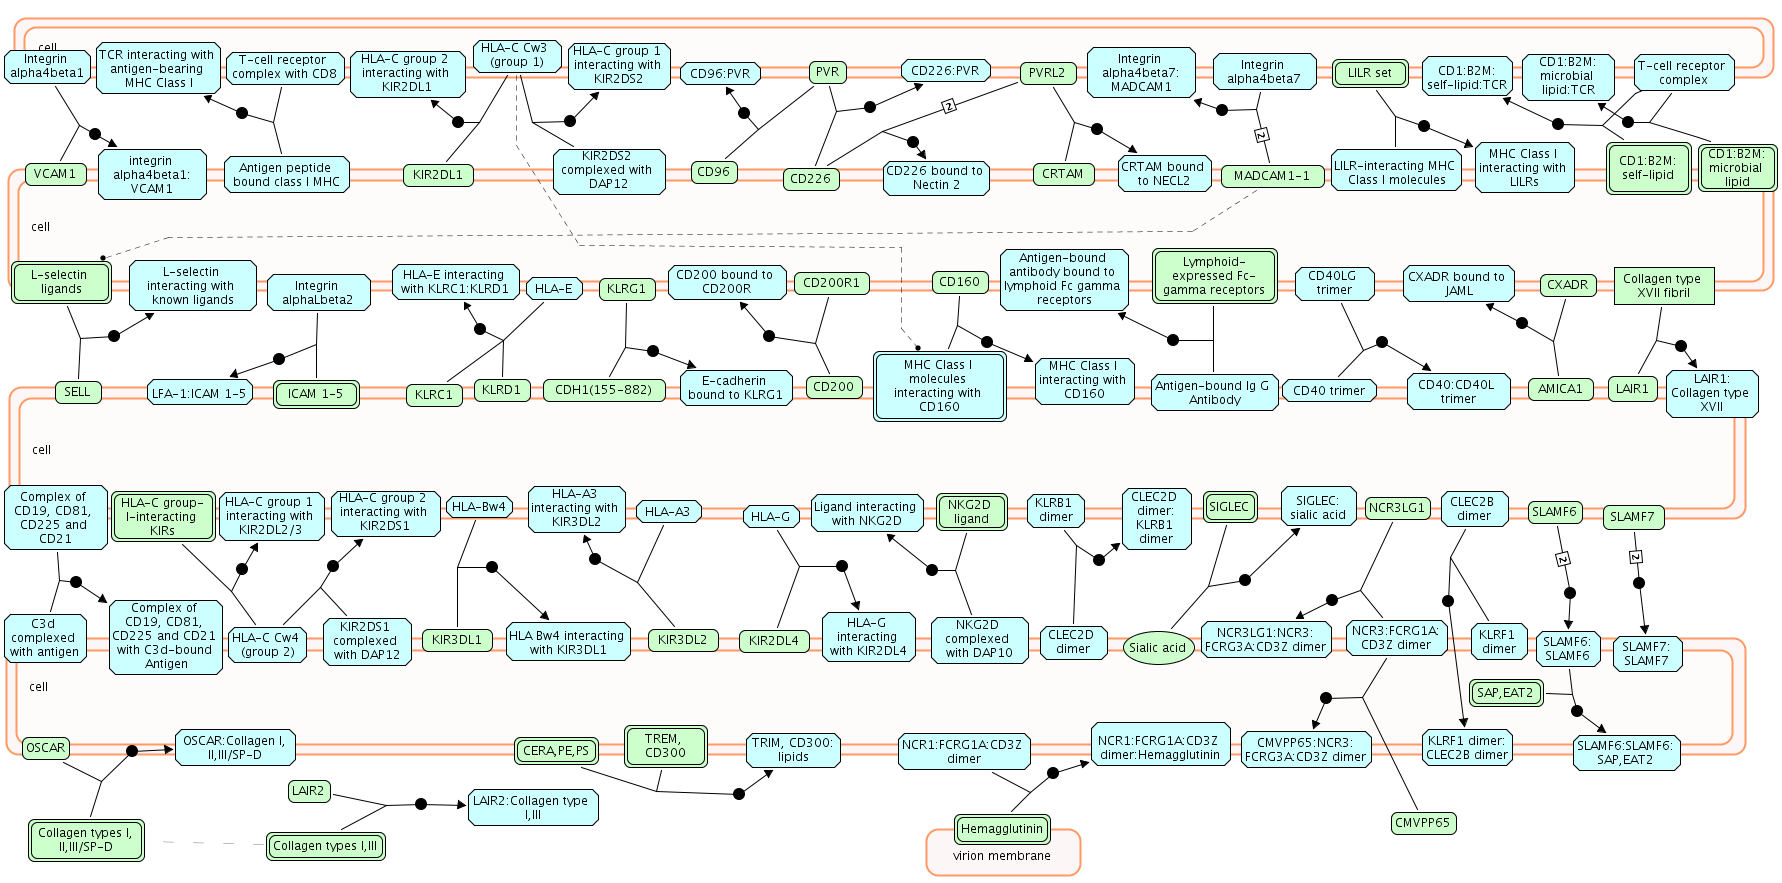
| Diagram of Immunoregulatory interactions between a Lymphoid and a non-Lymphoid cell.png | 2025-05-14 16:56 | 162K | |
| Diagram of IkBA variant leads to EDA-ID.png | 2025-05-14 16:56 | 34K | |
| Diagram of ISG15 antiviral mechanism.png | 2025-05-14 16:59 | 112K | |
| Diagram of IRAK4 deficiency (TLR5).png | 2025-05-14 16:56 | 179K | |
| Diagram of IRAK4 deficiency (TLR2-4).png | 2025-05-14 16:55 | 146K | |
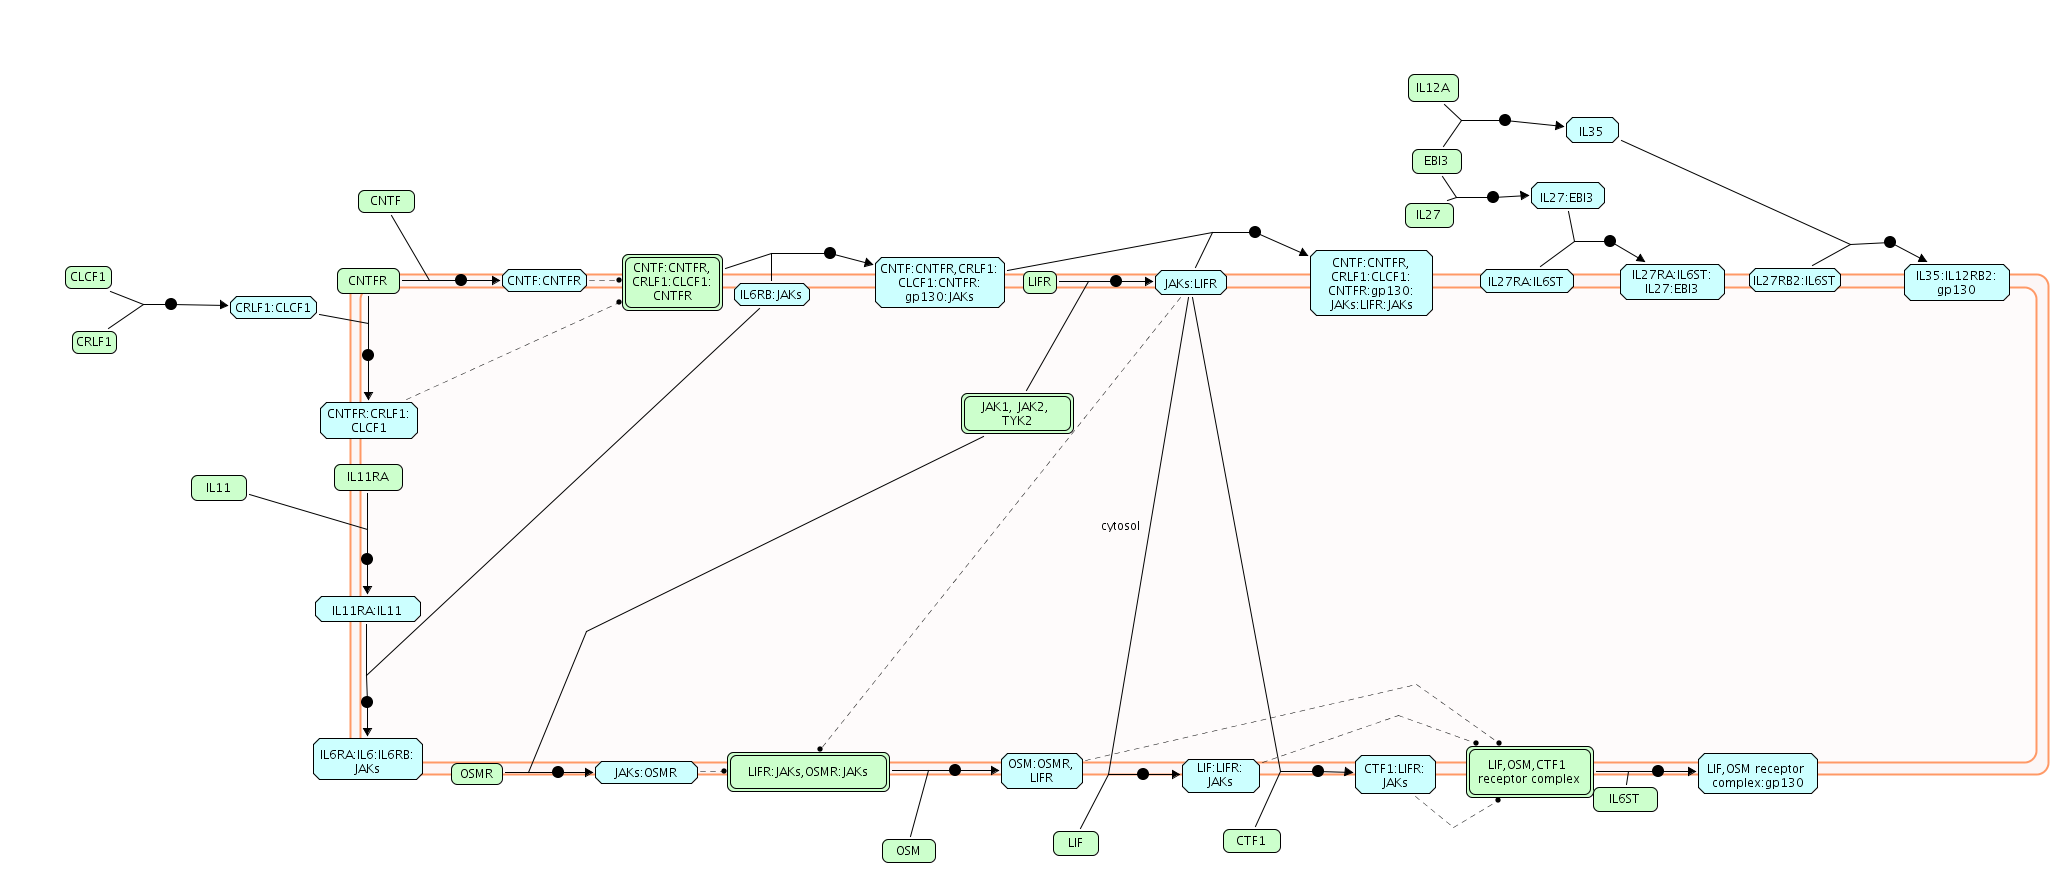
| Diagram of IL-6-type cytokine receptor ligand interactions.png | 2025-05-14 16:58 | 82K | |
| Diagram of IKBKG deficiency causes anhidrotic ectodermal dysplasia with immunodeficiency (EDA-ID) (via TLR).png | 2025-05-14 16:57 | 34K | |
| Diagram of IKBKB deficiency causes SCID.png | 2025-05-14 16:58 | 34K | |
| Diagram of Host Interactions with Influenza Factors.png | 2025-05-14 16:59 | 55K | |
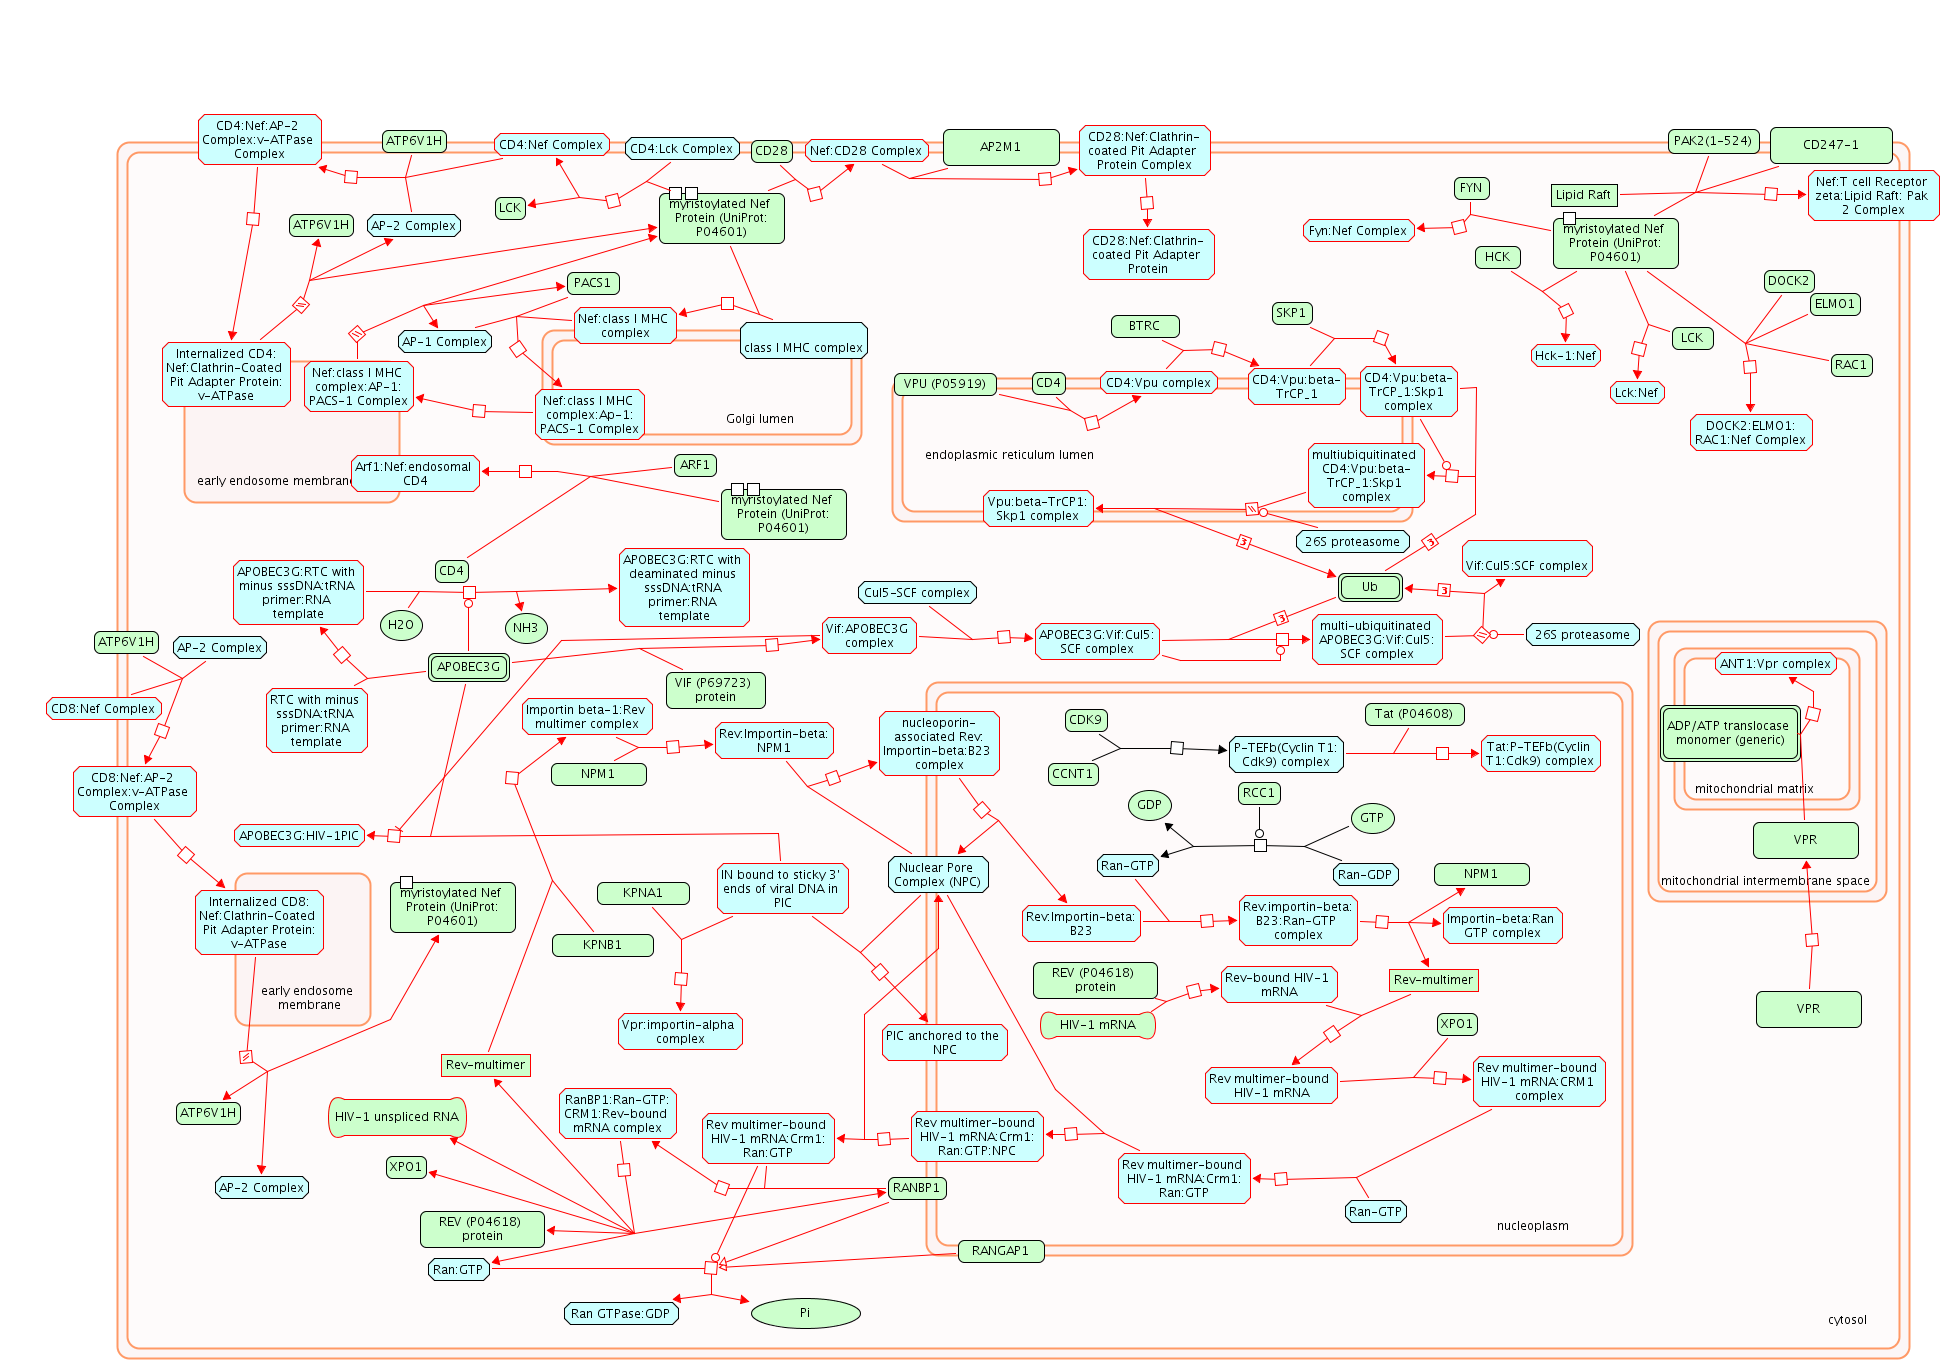
| Diagram of Host Interactions of HIV factors.png | 2025-05-14 16:57 | 271K | |
| Diagram of Homology Directed Repair.png | 2025-05-14 16:58 | 4.2K | |
| Diagram of Histidine.png | 2025-05-14 17:00 | 323K | |
| Diagram of Histidine, lysine, phenylalanine, tyrosine, proline and tryptophan catabolism and Phenylketonuria.png | 2025-05-14 16:58 | 323K | |
| Diagram of Hh mutants that don't undergo autocatalytic processing are degraded by ERAD.png | 2025-05-14 16:59 | 119K | |
| Diagram of Hh mutants abrogate ligand secretion.png | 2025-05-14 17:00 | 4.3K | |
| Diagram of Hh 'on'.png | 2025-05-14 16:59 | 281K | |
| Diagram of Hexose transport.png | 2025-05-14 16:58 | 91K | |
| Diagram of Hexose transport, Glycogen storage disease type Ia (G6PC), Glycogen storage disease type Ib (SLC37A4), Severe congenital neutropenia type 4 (G6PC3), Defective GCK causes maturity-onset diabetes of the young 2 (MODY2), Defective HK1 causes h.png | 2025-05-14 16:58 | 91K | |
| Diagram of Hemostasis.png | 2025-05-14 16:56 | 8.0K | |
| Diagram of Hedgehog signaling.png | 2025-05-14 16:58 | 2.2K | |
| Diagram of Hedgehog lig biogenesis.png | 2025-05-14 16:56 | 119K | |
| Diagram of Hedgehog ligand biogenesis, Hh mutants that don't undergo autocatalytic processing are degraded by ERAD, and HHAT G278V abrogates palmitoylation of Hh-Np.png | 2025-05-14 17:00 | 119K | |
| Diagram of Hedgehog 'off' state.png | 2025-05-14 16:58 | 260K | |
| Diagram of HIV Life Cycle.png | 2025-05-14 16:59 | 723K | |
| Diagram of HIV Infection.png | 2025-05-14 16:57 | 2.0K | |
| Diagram of HHAT G278V abrogates palmitoylation of Hh-Np.png | 2025-05-14 17:00 | 119K | |
| Diagram of HDR through MMEJ (alt-NHEJ).png | 2025-05-14 16:58 | 89K | |
| Diagram of HDR through Homologous Recombination (HR) or Single Strand Annealing (SSA).png | 2025-05-14 16:55 | 733K | |
| Diagram of Growth hormone receptor signaling.png | 2025-05-14 16:58 | 209K | |
| Diagram of Glyoxylate metabolism and glycine degradation.png | 2025-05-14 16:59 | 113K | |
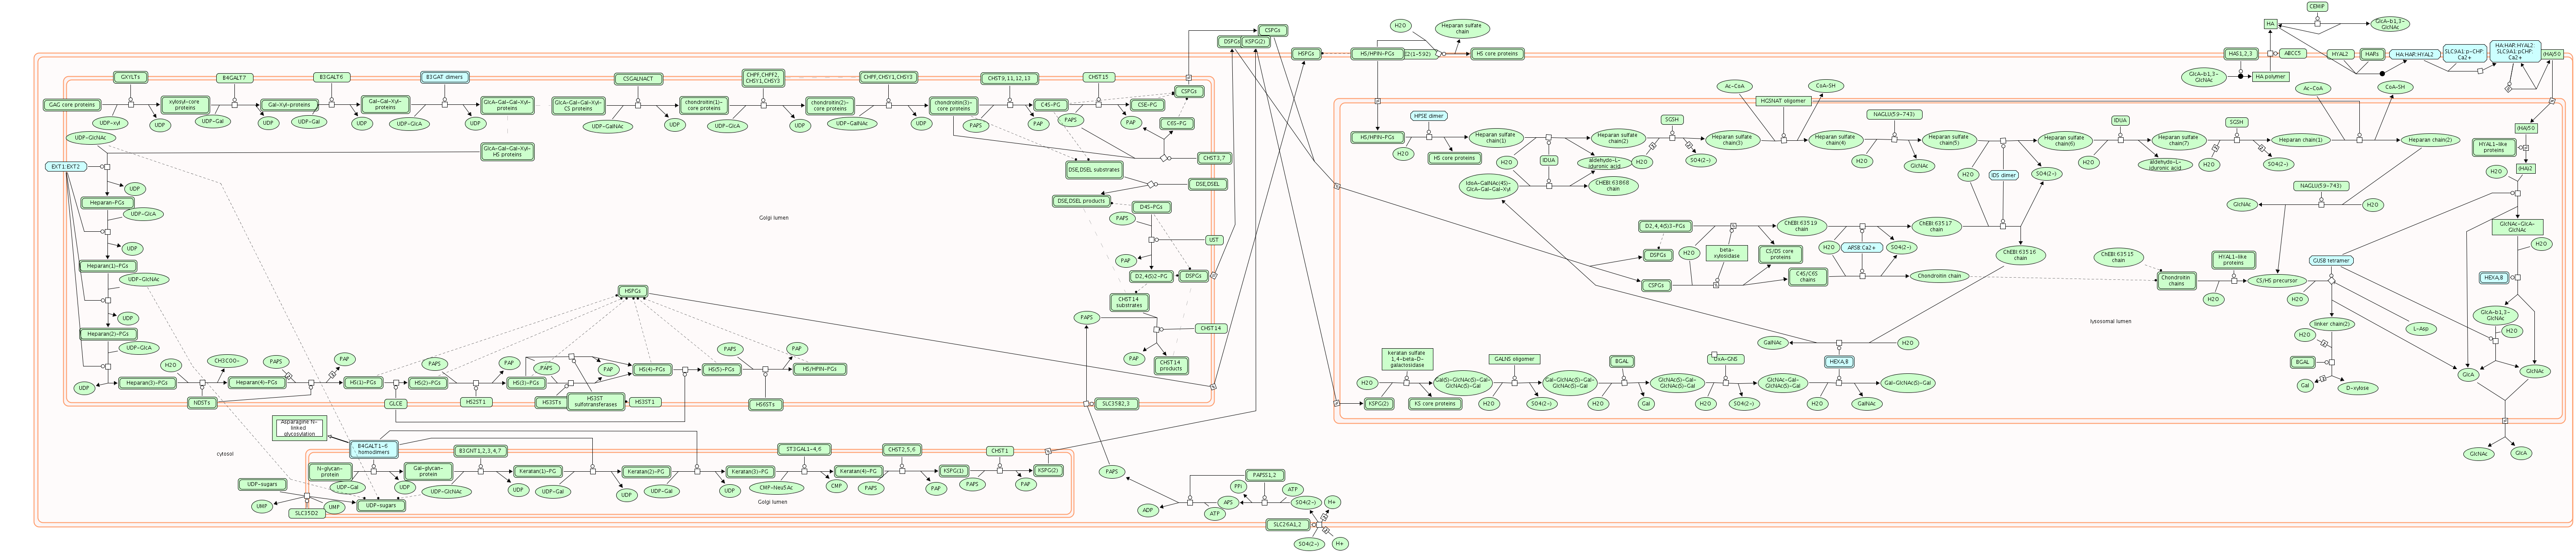
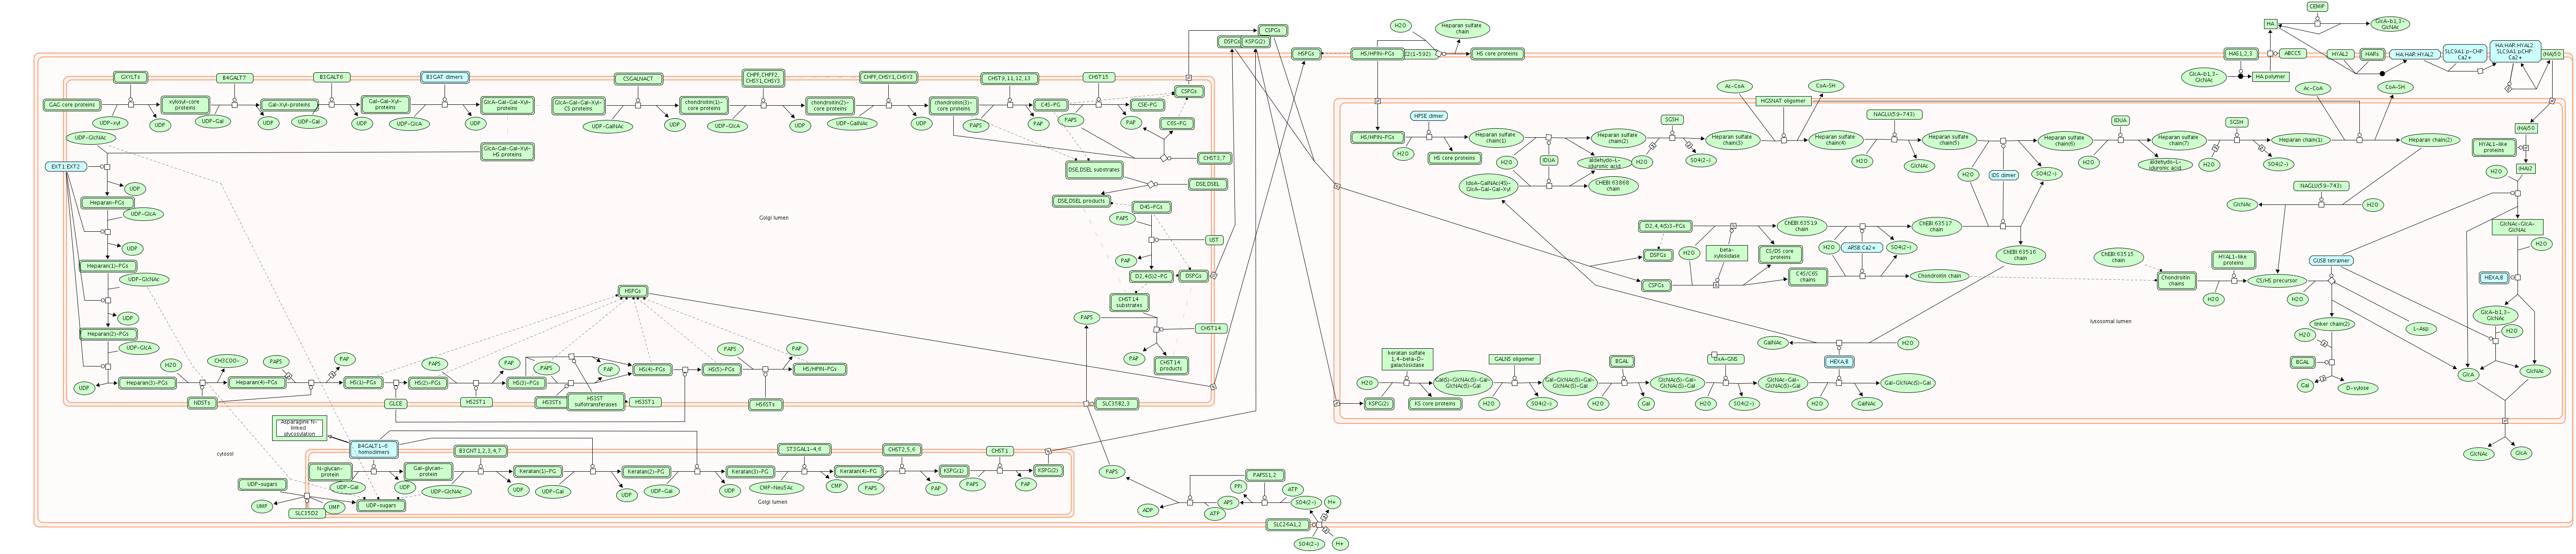
| Diagram of Glycosaminoglycan metabolism.png | 2025-05-14 16:58 | 548K | |
| Diagram of Glycosaminoglycan metabolism, MPS I - Hurler syndrome, MPS II - Hunter syndrome, MPS IIIA - Sanfilippo syndrome A, MPS IIIB - Sanfilippo syndrome B, MPS IIIC - Sanfilippo syndrome C, MPS IIID - Sanfilippo syndrome D, MPS IV - Morquio syndro.png | 2025-05-14 16:57 | 548K | |
| Diagram of Glycogen storage disease type XV (GYG.png | 2025-05-14 17:00 | 926K | |
| Diagram of Glycogen storage disease type Ib (SLC37A4).png | 2025-05-14 17:00 | 91K | |
| Diagram of Glycogen storage disease type Ia (G6PC).png | 2025-05-14 16:59 | 91K | |
| Diagram of Glycogen storage disease type IV (GBE1).png | 2025-05-14 16:57 | 926K | |
| Diagram of Glycogen storage disease type II (GAA).png | 2025-05-14 17:00 | 926K | |
| Diagram of Glycogen storage disease type 0 (muscle GYS1).png | 2025-05-14 16:58 | 926K | |
| Diagram of Glycogen storage disease type 0 (liver GYS2).png | 2025-05-14 16:58 | 926K | |
| Diagram of Glycogen storage diseases.png | 2025-05-14 17:00 | 12K | |
| Diagram of Glycerophospholipid biosynthesis.png | 2025-05-14 16:59 | 779K | |
| Diagram of Generic Transcription Pathway.png | 2025-05-14 17:01 | 248K | |
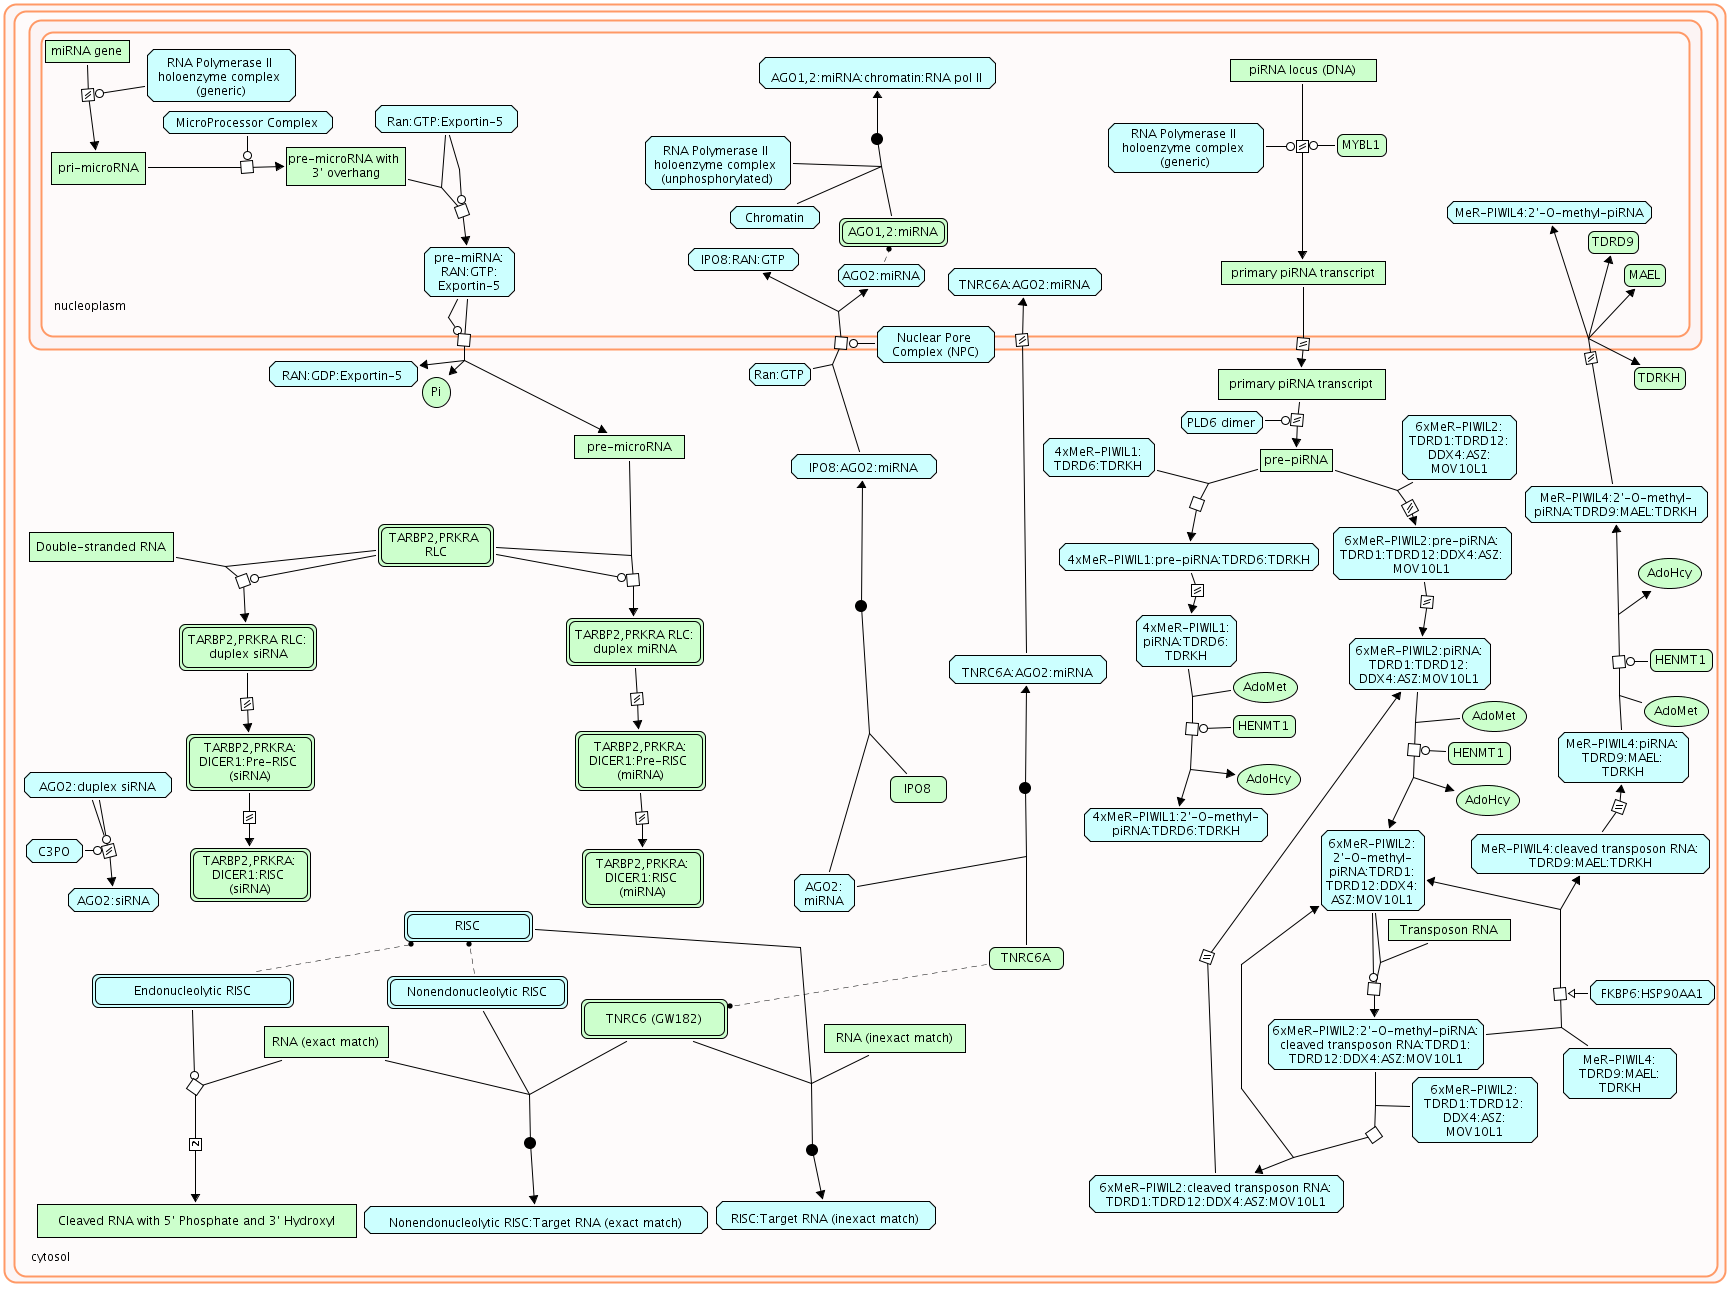
| Diagram of Gene Silencing by RNA.png | 2025-05-14 16:56 | 198K | |
| Diagram of Gene Expression.png | 2025-05-14 16:58 | 53K | |
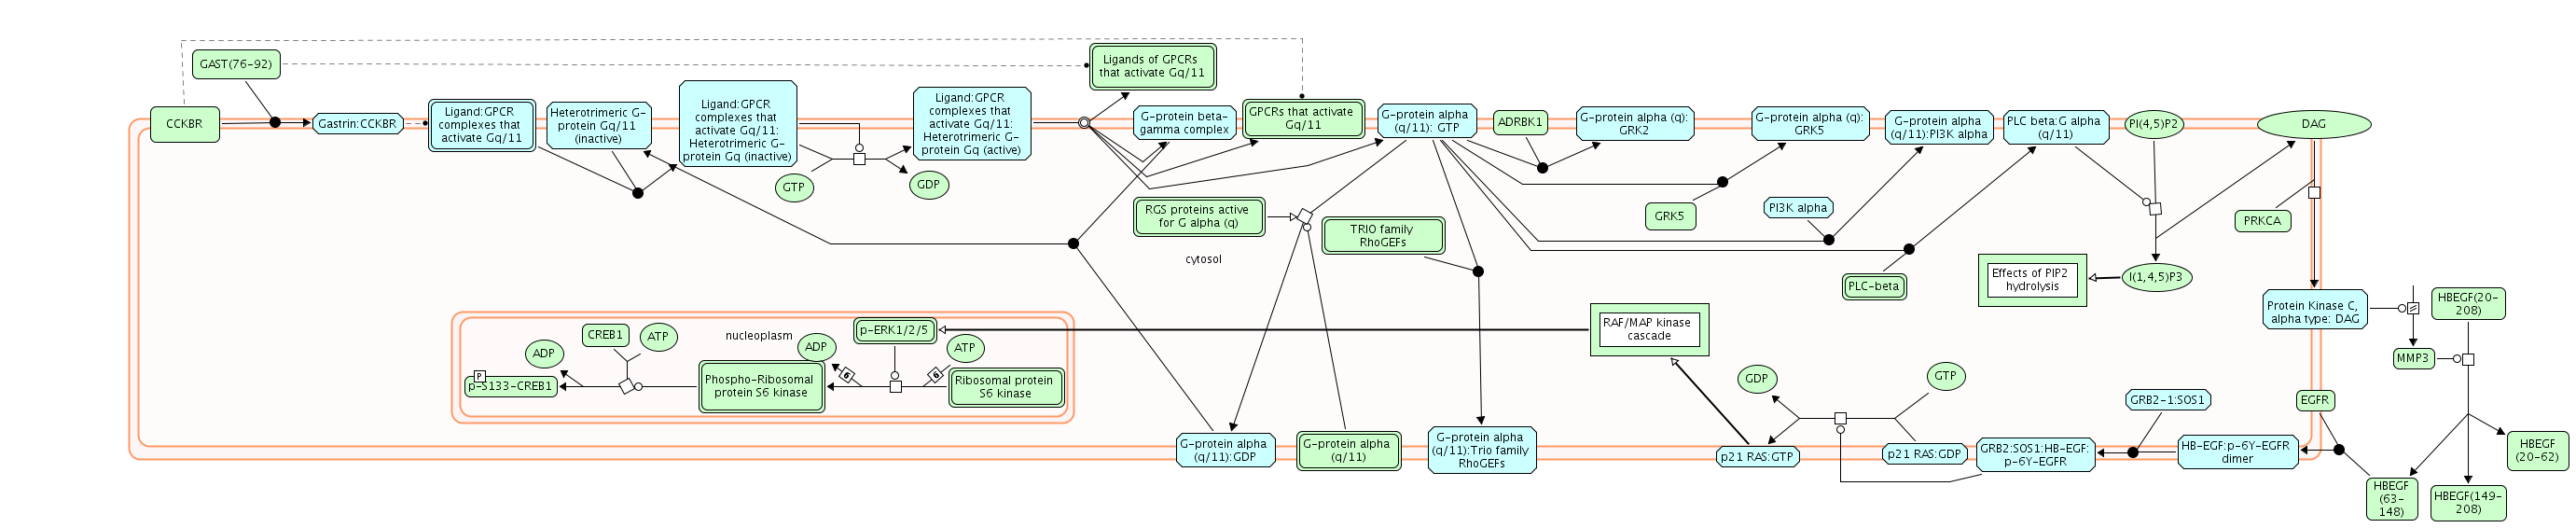
| Diagram of Gastrin-CREB signalling pathway via PKC and MAPK.png | 2025-05-14 16:58 | 126K | |
| Diagram of Gap junction trafficking and regulation.png | 2025-05-14 16:59 | 103K | |
| Diagram of Gamma carboxylation.png | 2025-05-14 16:55 | 366K | |
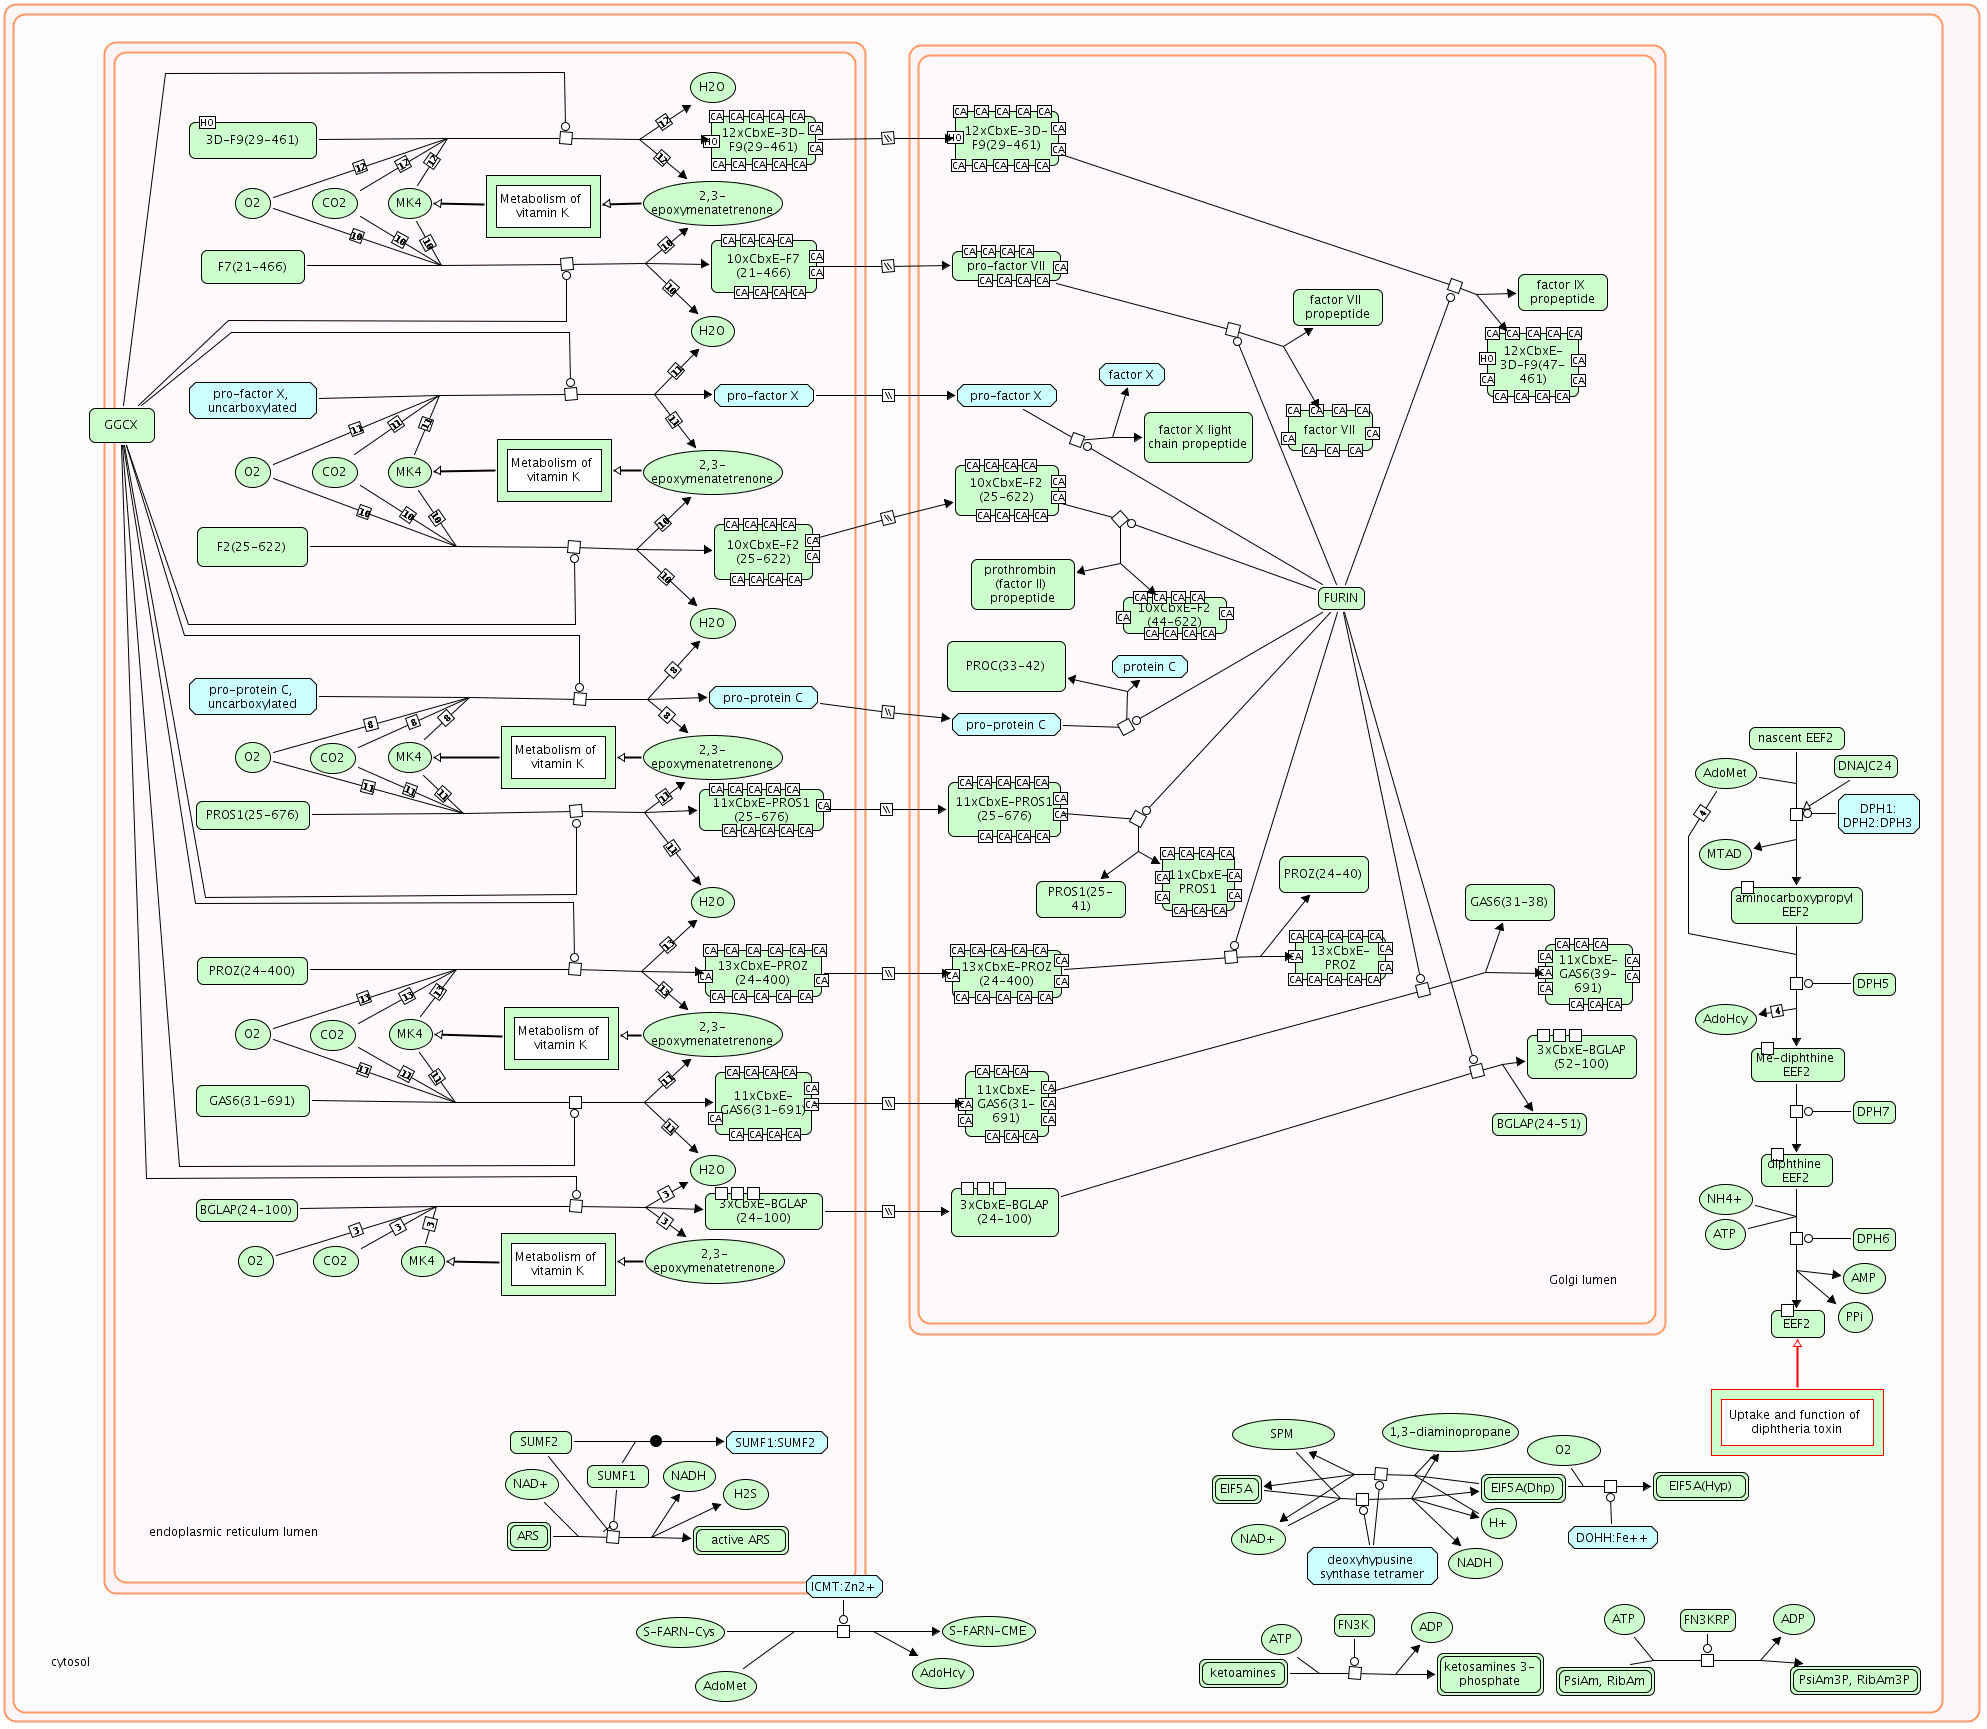
| Diagram of Gamma carboxylation, hypusine formation and arylsulfatase activation.png | 2025-05-14 16:57 | 366K | |
| Diagram of GPVI-mediated activation cascade.png | 2025-05-14 17:00 | 153K | |
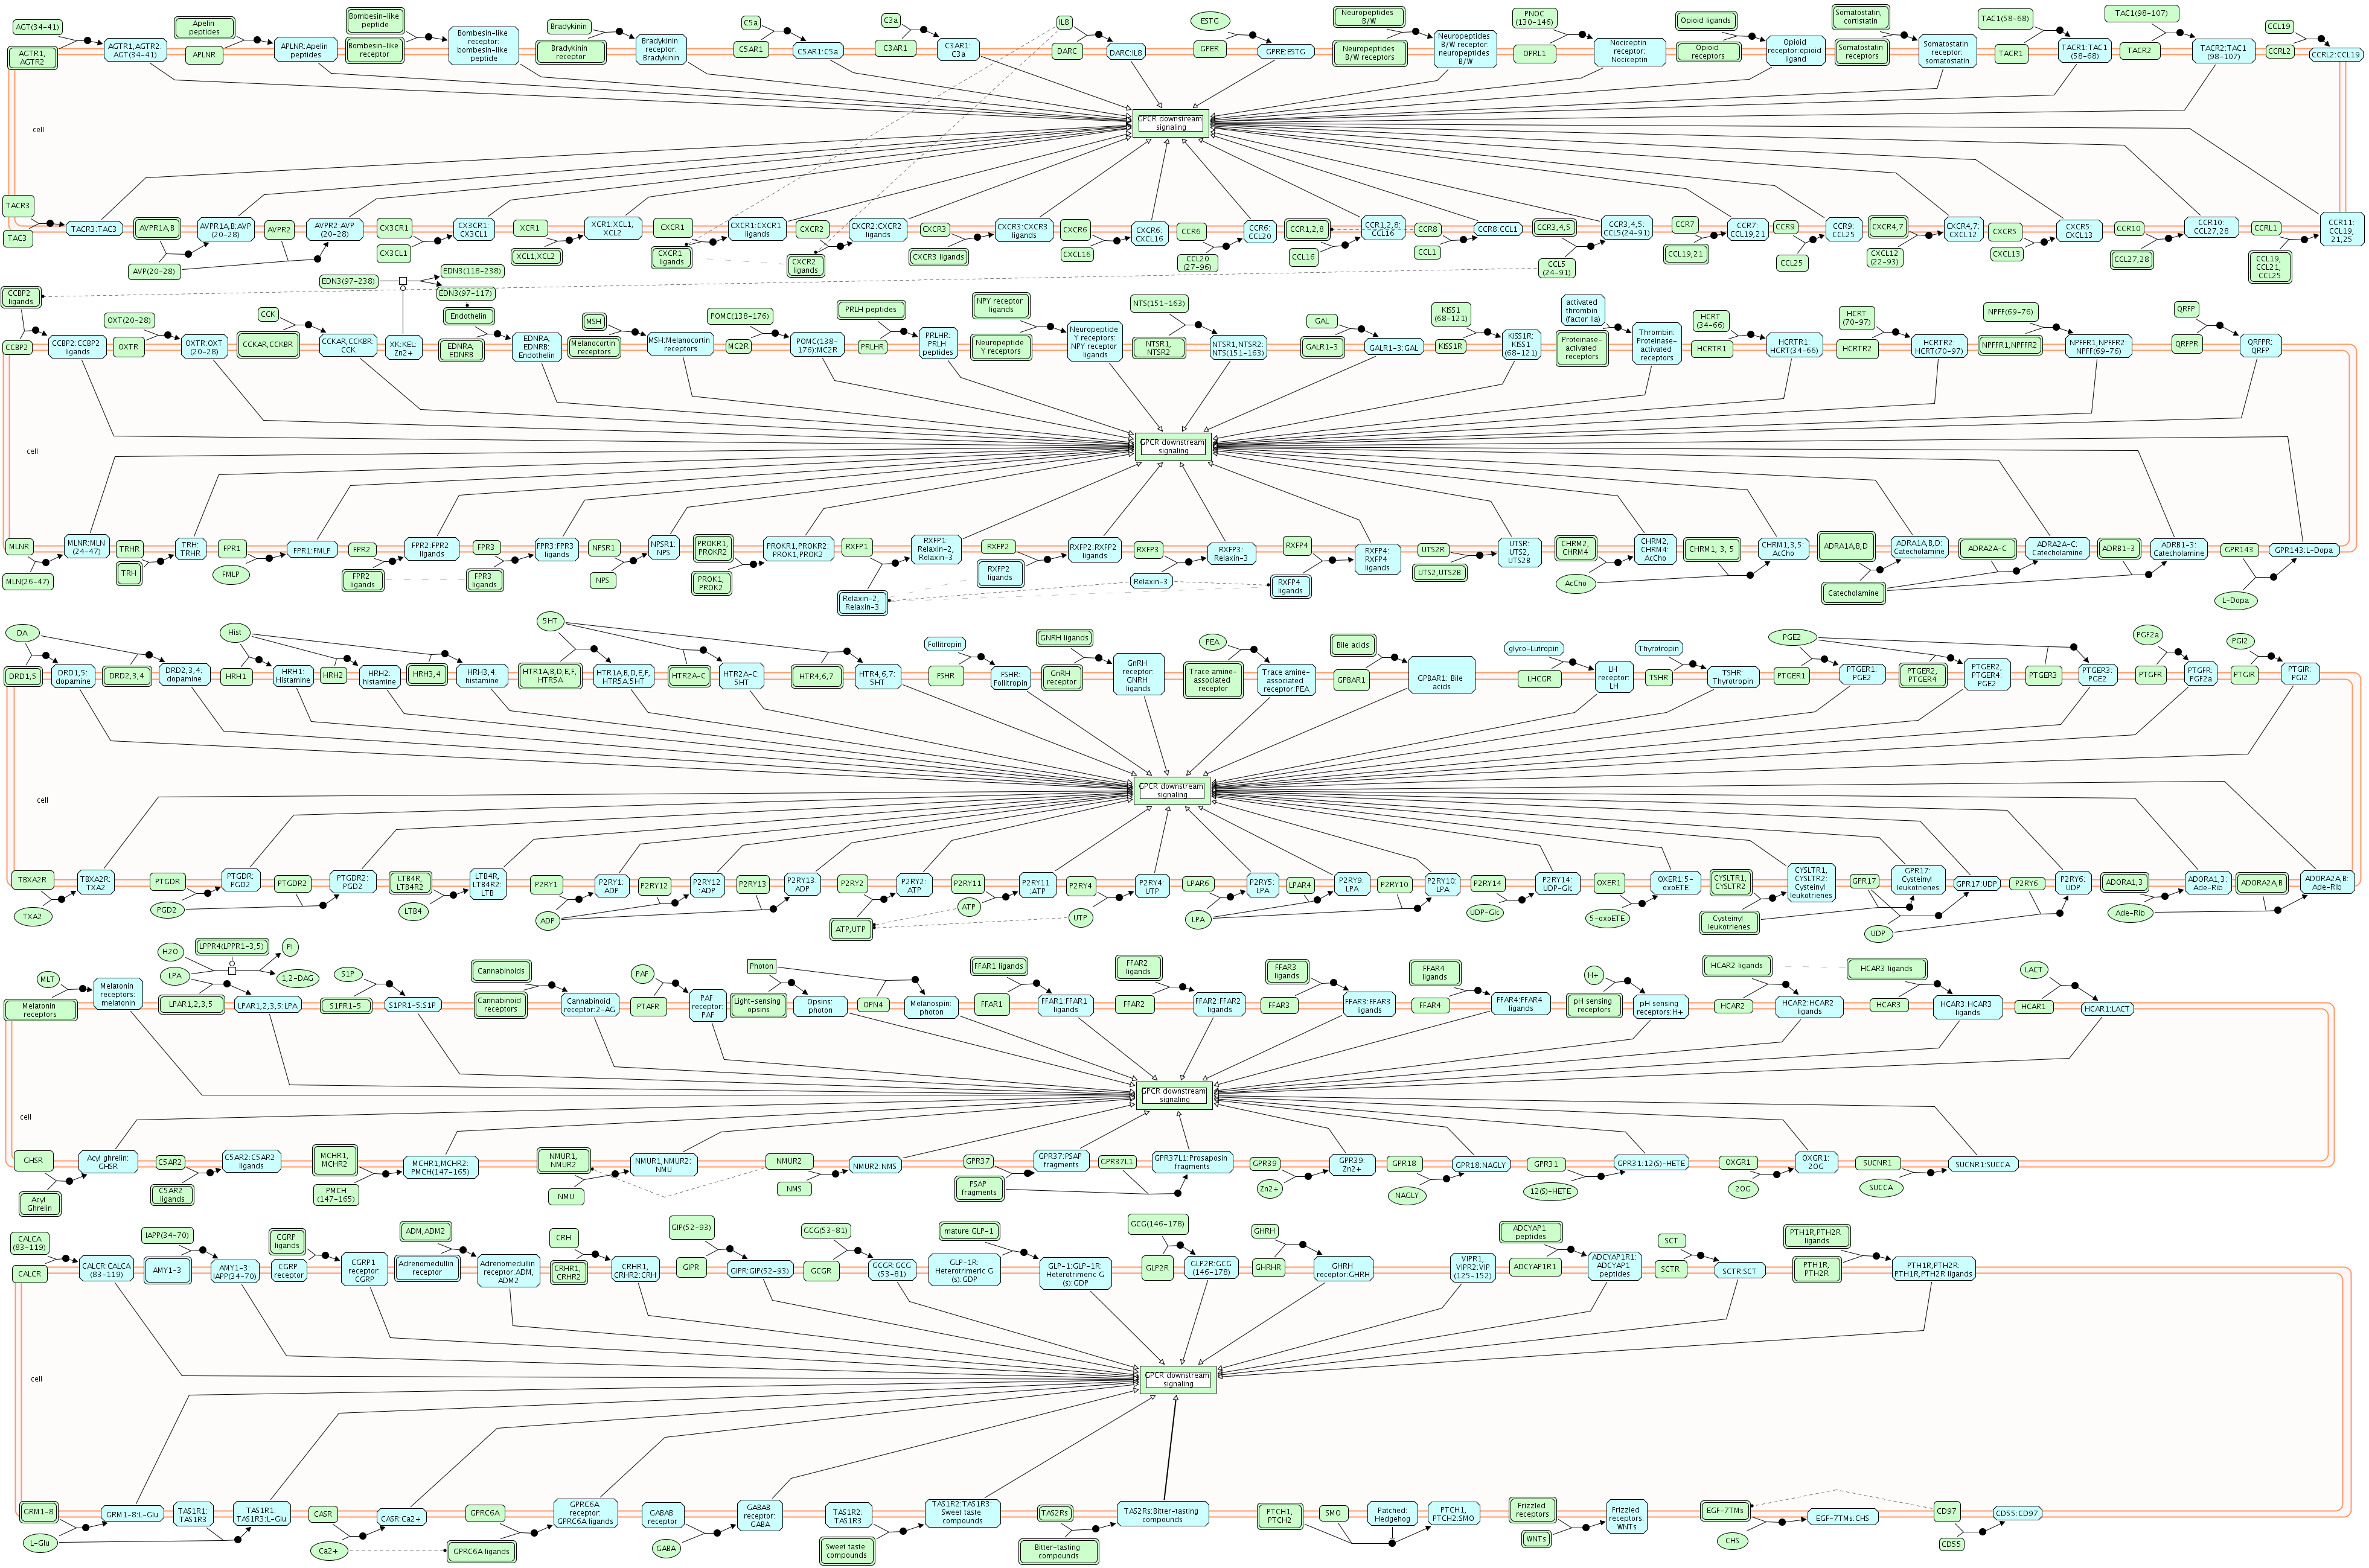
| Diagram of GPCR lig binding.png | 2025-05-14 16:56 | 1.2M | |
| Diagram of GPCR ligand binding, Defective ACTH causes Obesity and Pro-opiomelanocortinin deficiency (POMCD), and Defective AVP causes neurohypophyseal diabetes insipidus (NDI).png | 2025-05-14 16:56 | 1.2M | |
| Diagram of GPCR downstream signaling.png | 2025-05-14 16:55 | 794K | |
| Diagram of GP1b-IX-V activation signalling.png | 2025-05-14 16:56 | 26K | |
| Diagram of GABA synthesis.png | 2025-05-14 16:57 | 106K | |
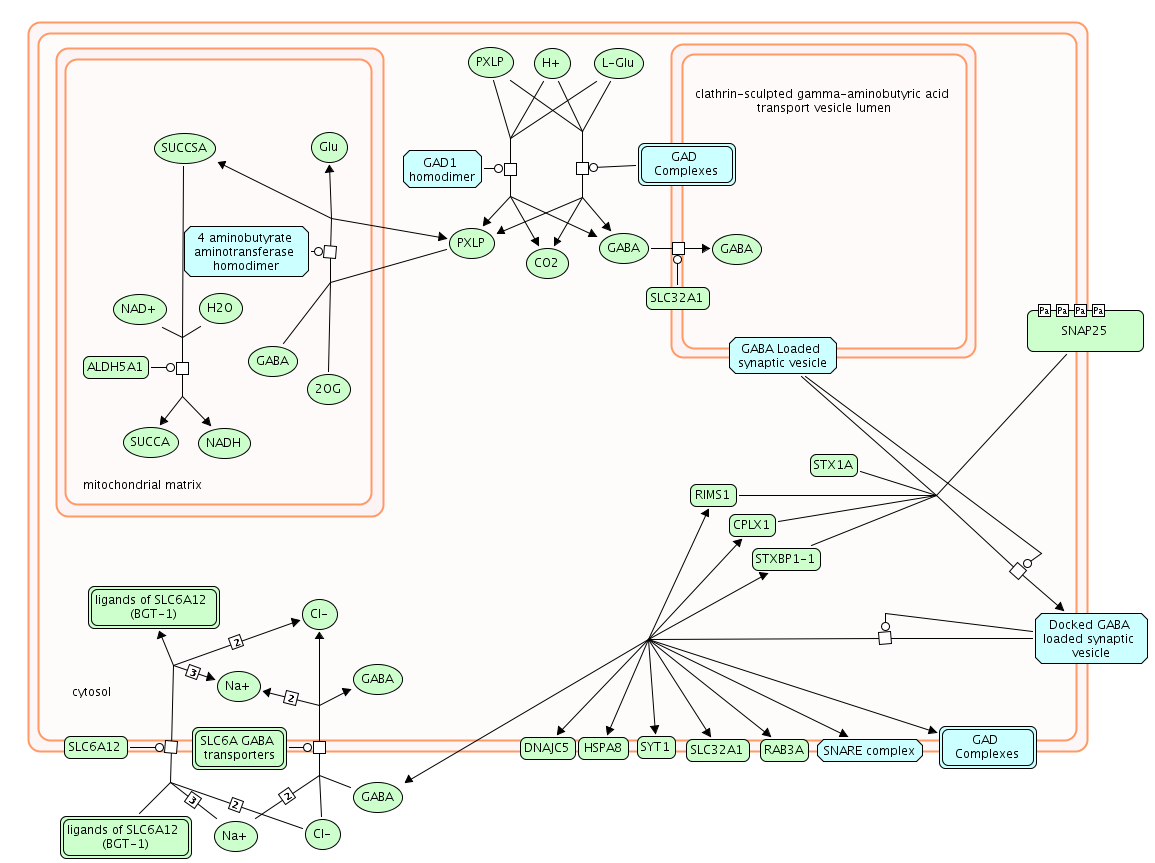
| Diagram of GABA synthesis, release, reuptake and degradation.png | 2025-05-14 17:00 | 106K | |
| Diagram of Formation of Fibrin Clot (Clotting Cascade).png | 2025-05-14 16:59 | 427K | |
| Diagram of Fertilization.png | 2025-05-14 17:00 | 60K | |
| Diagram of Fcgamma receptor (FCGR) dependent phagocytosis.png | 2025-05-14 16:58 | 301K | |
| Diagram of Fc epsilon receptor (FCERI) signaling.png | 2025-05-14 16:59 | 535K | |
| Diagram of Fatty acid.png | 2025-05-14 16:56 | 731K | |
| Diagram of Fatty acid, triacylglycerol, and ketone body metabolism.png | 2025-05-14 16:59 | 731K | |
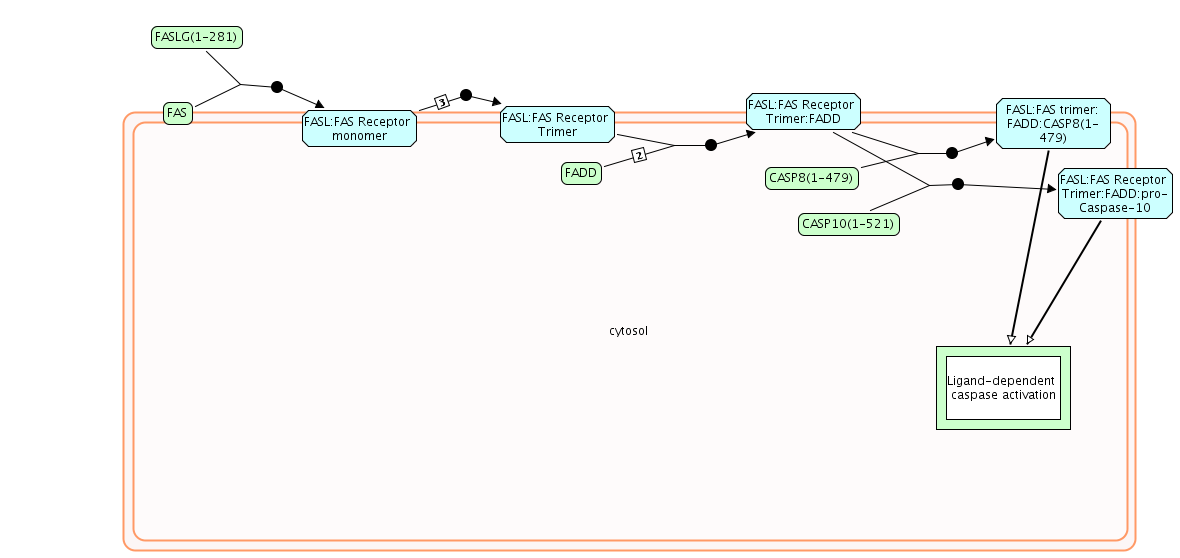
| Diagram of FasL- CD95L signaling.png | 2025-05-14 16:57 | 29K | |
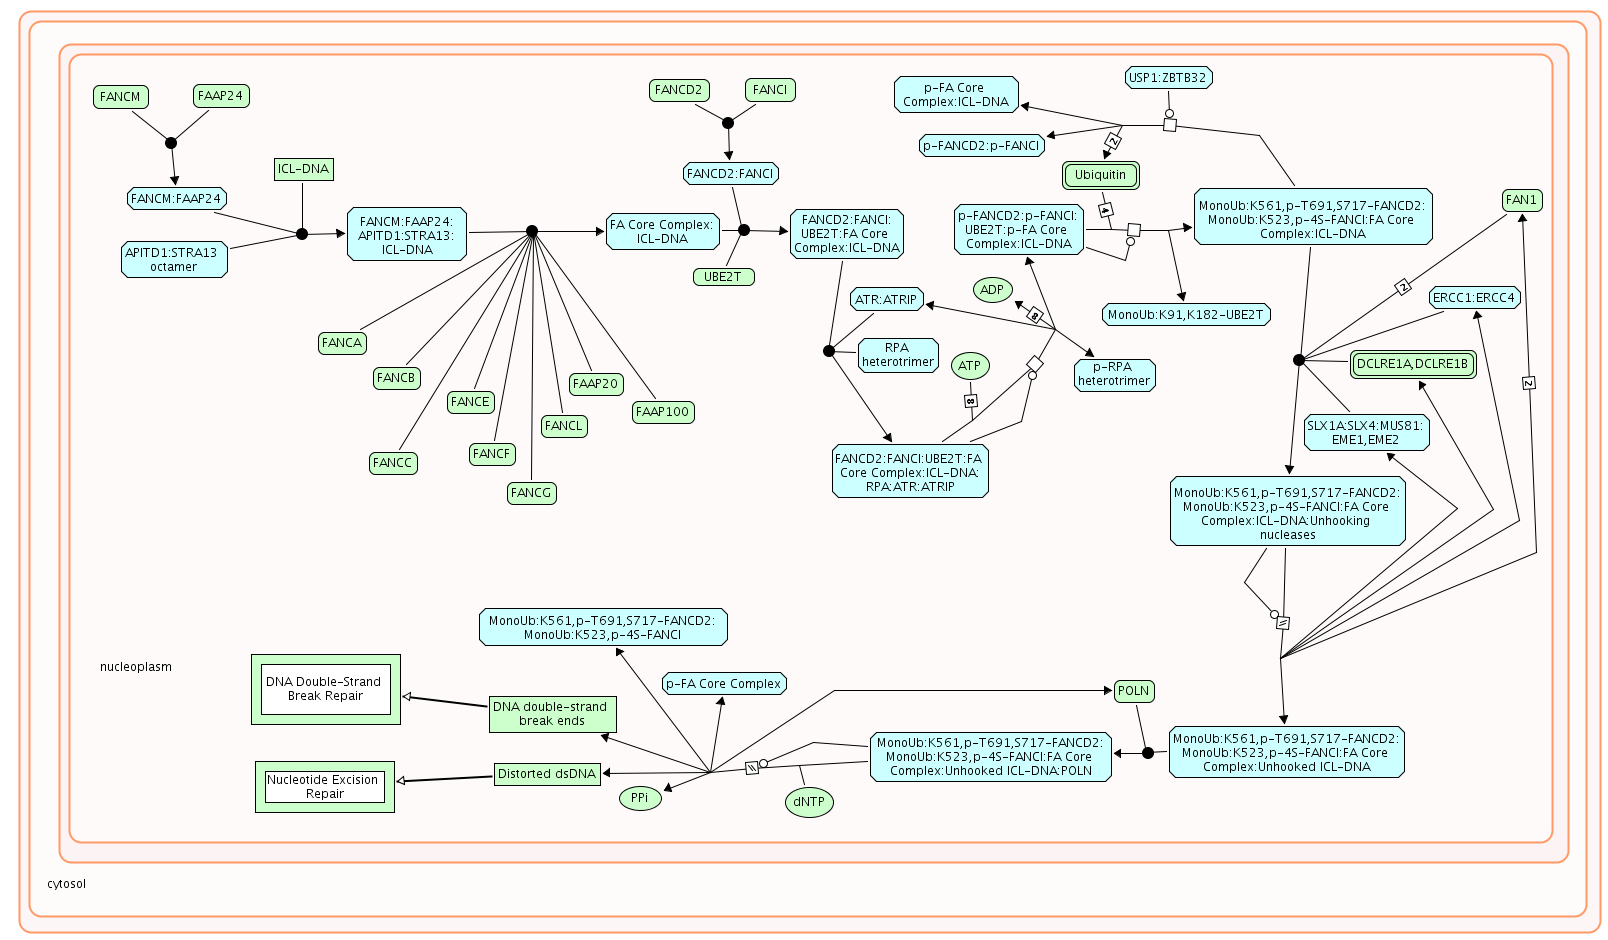
| Diagram of Fanconi Anemia Pathway.png | 2025-05-14 16:59 | 133K | |
| Diagram of Factors involved in megakaryocyte development and platelet production.png | 2025-05-14 16:57 | 151K | |
| Diagram of FBXW7 Mutants NOTCH1 in Cancer.png | 2025-05-14 16:58 | 209K | |
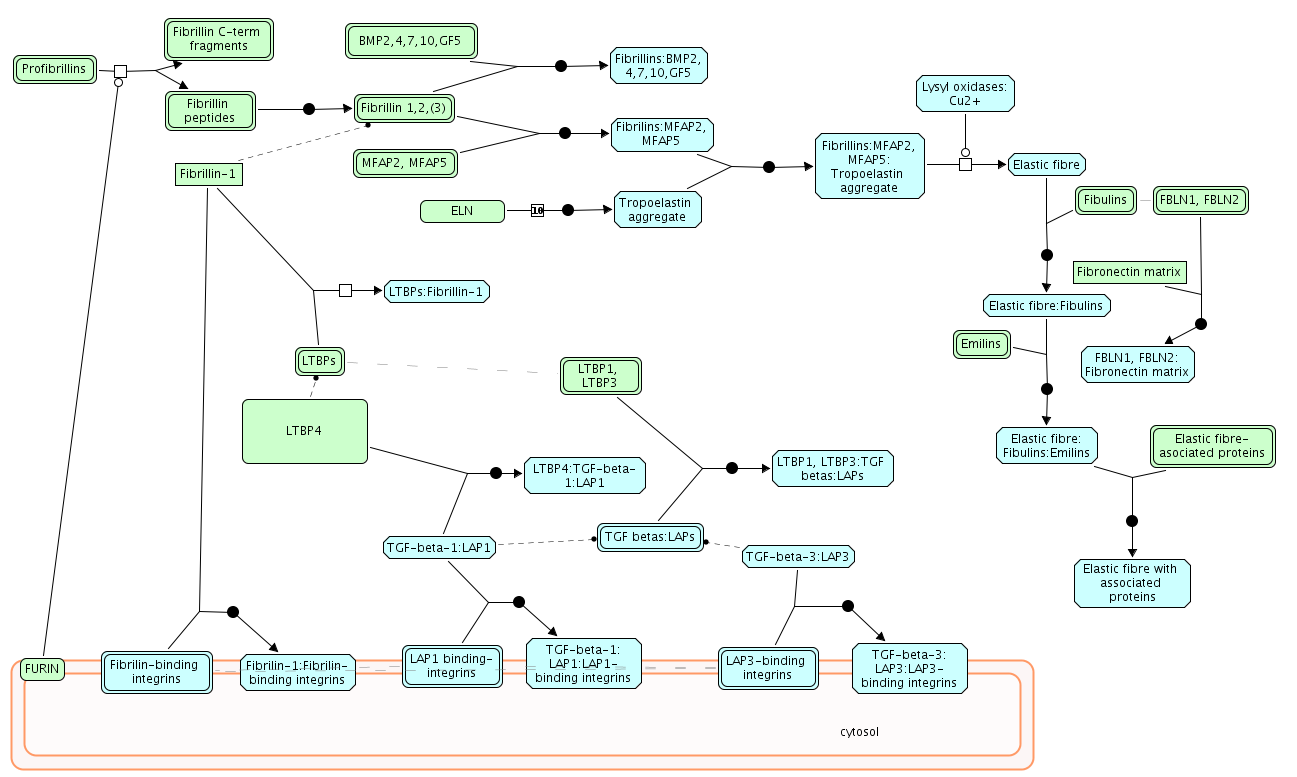
| Diagram of Extracellular matrix organization.png | 2025-05-14 16:57 | 323K | |
| Diagram of Eukaryotic Translation Termination.png | 2025-05-14 16:56 | 30K | |
| Diagram of Eukaryotic Translation Initiation.png | 2025-05-14 16:57 | 174K | |
| Diagram of Eukaryotic Translation Elongation.png | 2025-05-14 16:57 | 57K | |
| Diagram of Erythrocytes take up oxygen and release carbon dioxide.png | 2025-05-14 16:58 | 54K | |
| Diagram of Erythrocytes take up carbon dioxide release oxygen Defective SLC4A1 causes hereditary spherocytosis type 4 (HSP4).png | 2025-05-14 16:59 | 60K | |
| Diagram of Erythrocytes take up carbon dioxide and release oxygen and Defective SLC4A1 causes hereditary spherocytosis type 4 (HSP4), distal renal tubular acidosis (dRTA) and dRTA with hemolytic anemia (dRTA-HA).png | 2025-05-14 16:56 | 60K | |
| Diagram of Epigenetic regulation of gene expression.png | 2025-05-14 16:56 | 12K | |
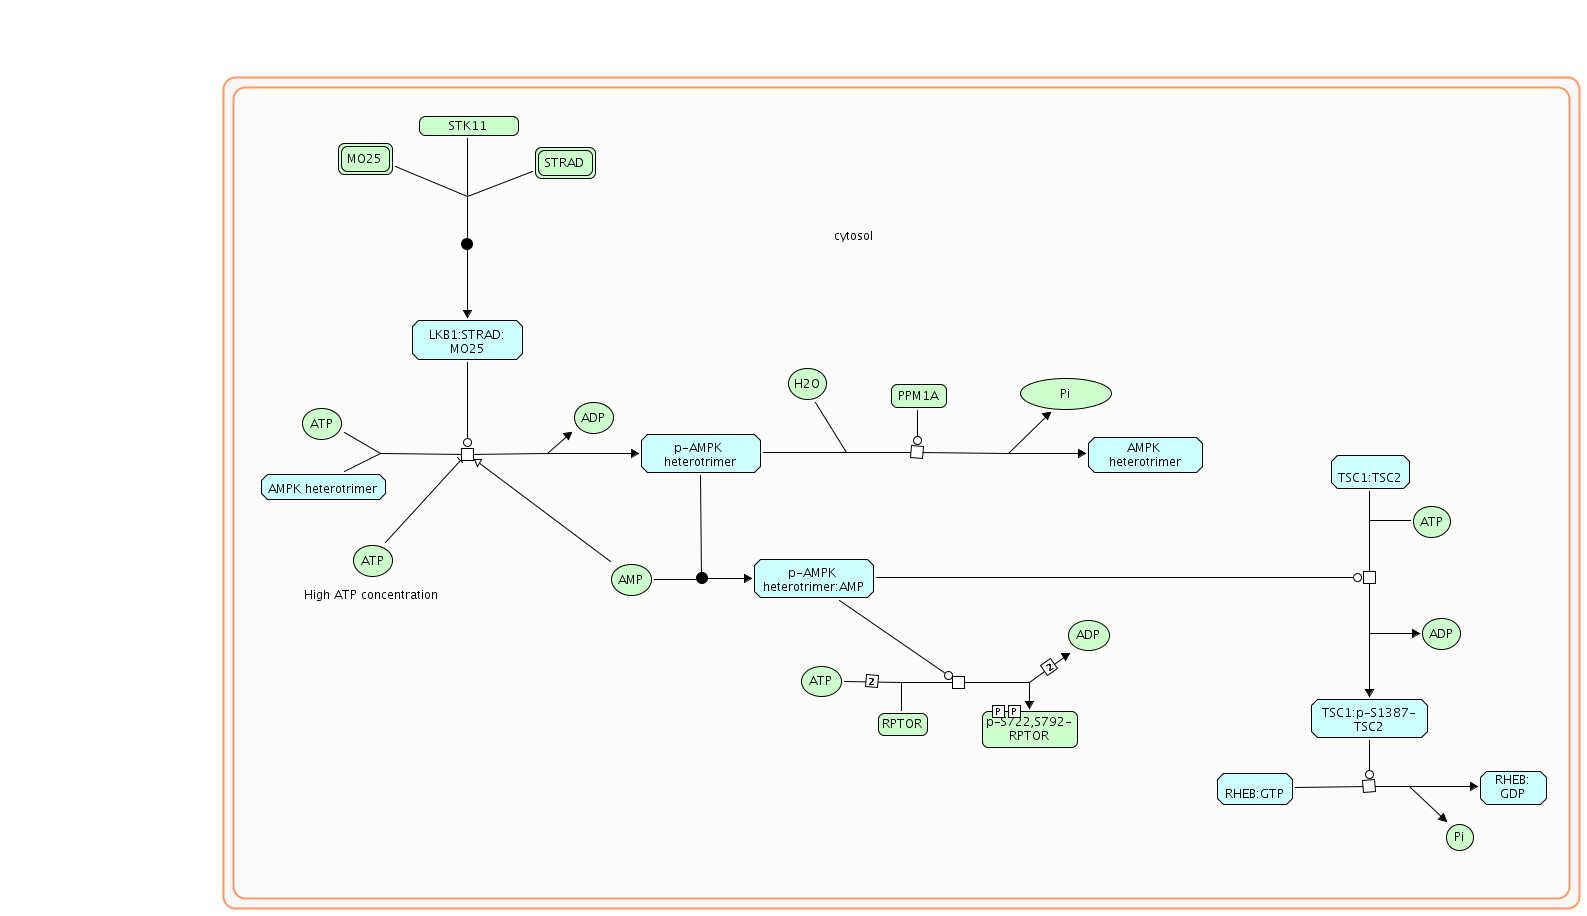
| Diagram of Energy dependent regulation of mTOR by LKB1-AMPK.png | 2025-05-14 16:57 | 48K | |
| Diagram of Endosomal Sorting Complex Required For Transport (ESCRT).png | 2025-05-14 16:57 | 45K | |
| Diagram of Elastic fibre formation.png | 2025-05-14 16:56 | 71K | |
| Diagram of Effects of PIP2 hydrolysis.png | 2025-05-14 16:56 | 62K | |
| Diagram of ER to Golgi Anterograde Transport and COPII (Coat Protein 2) Mediated Vesicle Transport.png | 2025-05-14 16:58 | 331K | |
| Diagram of ERCC6 (CSB) and EHMT2 (G9a) positively regulate rRNA expression.png | 2025-05-14 16:56 | 26K | |
| Diagram of EPH signaling.png | 2025-05-14 16:57 | 406K | |
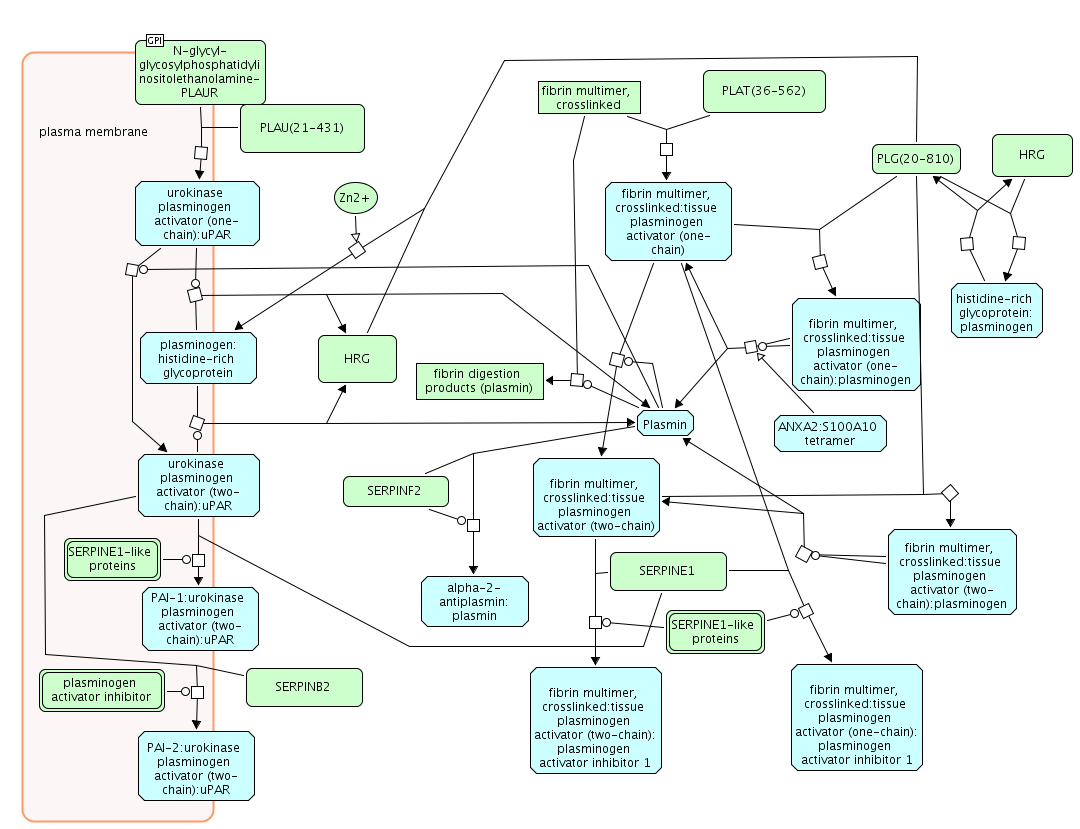
| Diagram of Dissolution of Fibrin Clot.png | 2025-05-14 16:55 | 106K | |
| Diagram of Disorders of transmembrane transporters.png | 2025-05-14 17:00 | 1.6K | |
| Diagram of Diseases of signal transduction.png | 2025-05-14 16:56 | 9.7K | |
| Diagram of Diseases of metabolism.png | 2025-05-14 16:58 | 8.0K | |
| Diagram of Diseases of glycosylation.png | 2025-05-14 16:58 | 4.0K | |
| Diagram of Diseases of carbohydrate metabolism.png | 2025-05-14 16:56 | 9.2K | |
| Diagram of Diseases of Immune System.png | 2025-05-14 16:56 | 2.4K | |
| Diagram of Diseases associated with visual transduction.png | 2025-05-14 16:56 | 2.1K | |
| Diagram of Diseases associated with the TLR signaling cascade.png | 2025-05-14 16:56 | 10K | |
| Diagram of Diseases associated with surfactant metabolism.png | 2025-05-14 16:59 | 11K | |
| Diagram of Diseases associated with glycosylation precursor biosynthesis.png | 2025-05-14 16:57 | 17K | |
| Diagram of Diseases associated with glycosaminoglycan metabolism.png | 2025-05-14 17:00 | 15K | |
| Diagram of Diseases associated with O-glycosylation of proteins.png | 2025-05-14 16:58 | 11K | |
| Diagram of Diseases associated with N-glycosylation of proteins.png | 2025-05-14 16:57 | 26K | |
| Diagram of Disease.png | 2025-05-14 16:59 | 5.7K | |
| Diagram of Developmental Biology.png | 2025-05-14 16:58 | 11K | |
| Diagram of Detoxification of Reactive Oxygen Species.png | 2025-05-14 16:59 | 253K | |
| Diagram of Depolarization of the Presynaptic Terminal Triggers the Opening of Calcium Channels.png | 2025-05-14 16:56 | 13K | |
| Diagram of Degradation of the extracellular matrix.png | 2025-05-14 16:58 | 200K | |
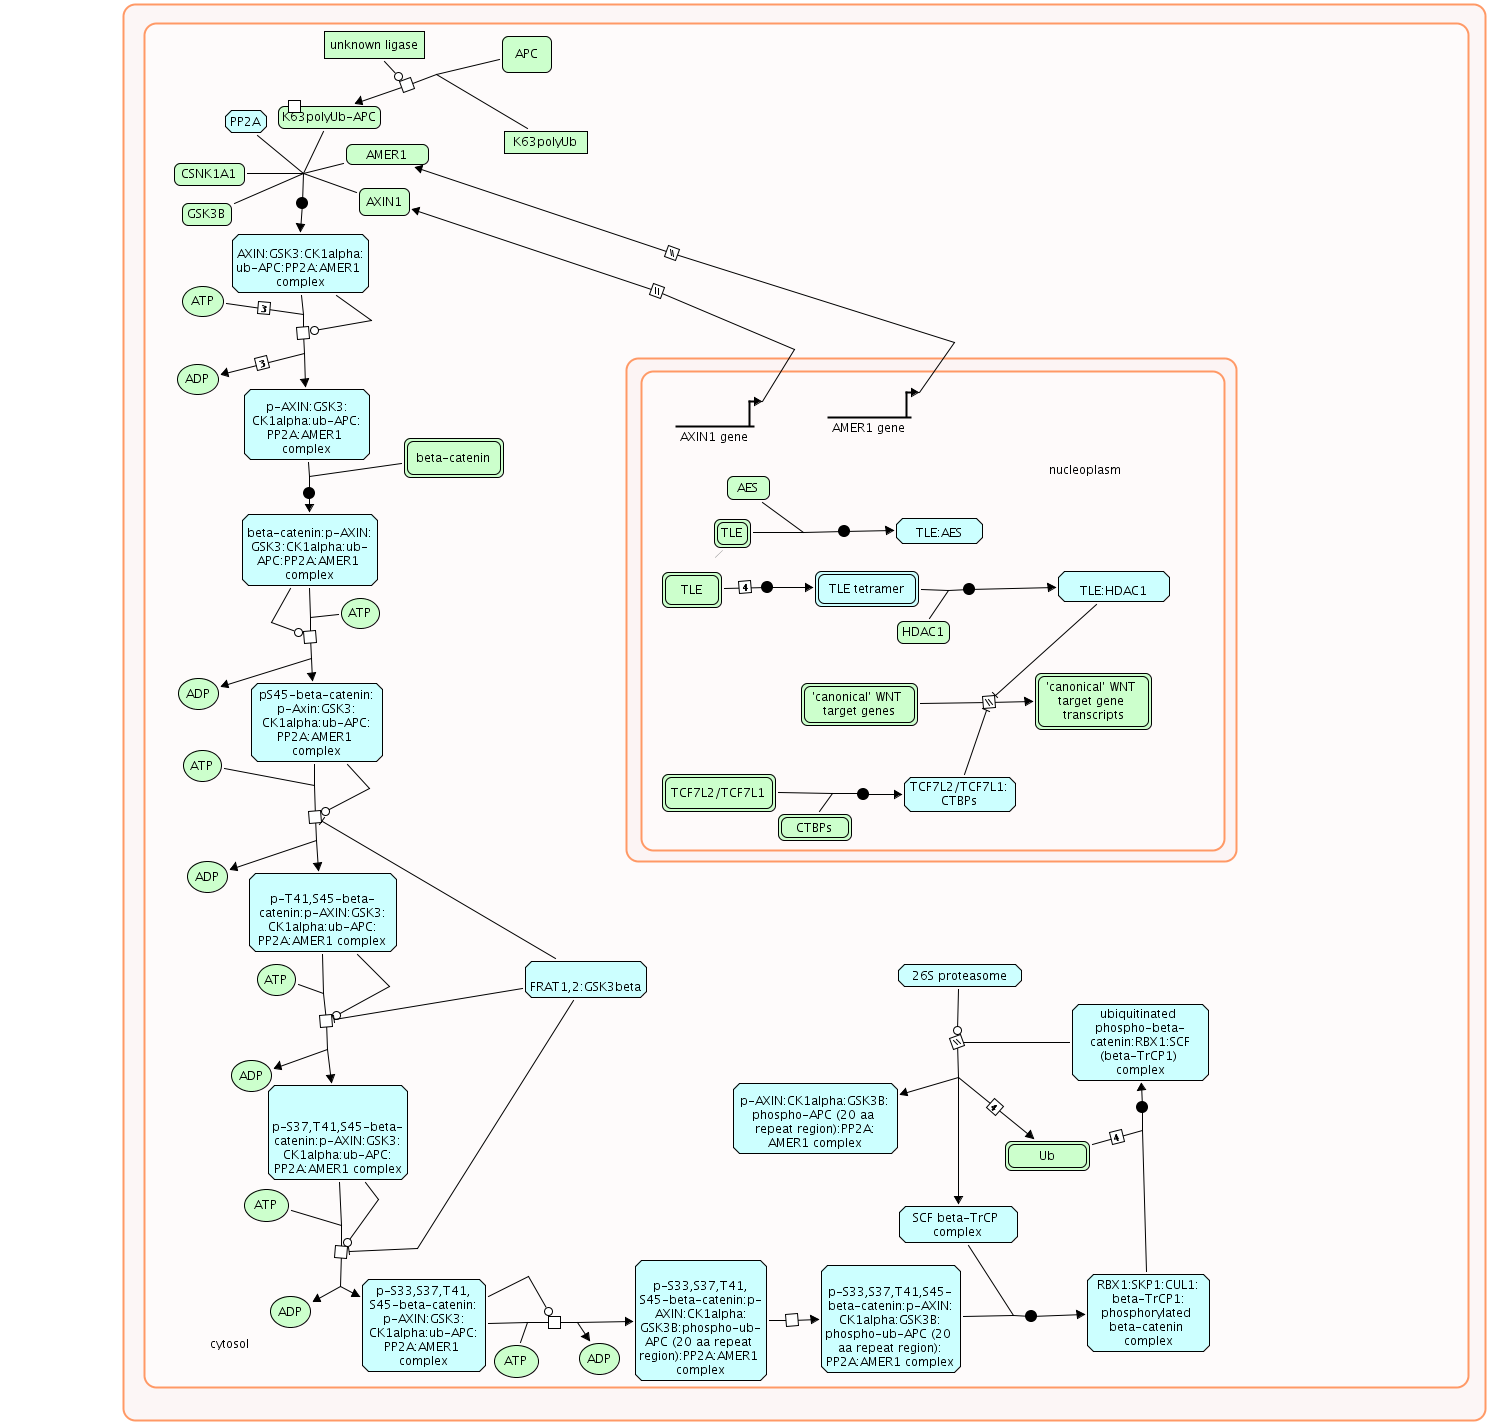
| Diagram of Degradation of beta-catenin by the destruction complex.png | 2025-05-14 16:59 | 148K | |
| Diagram of Degradation of beta-catenin by the destruction complex, TCF7L2 mutants don't bind CTBP, Misspliced GSK3beta mutants stabilize beta-catenin, S45 mutants of beta-catenin aren't phosphorylated, T41 mutants of beta-catenin aren't phosphorylated.png | 2025-05-14 16:57 | 148K | |
| Diagram of Defensins.png | 2025-05-14 16:55 | 85K | |
| Diagram of Defects in vitamin and cofactor metabolism.png | 2025-05-14 16:58 | 2.4K | |
| Diagram of Defects in cobalamin (B12) metabolism.png | 2025-05-14 16:56 | 25K | |
| Diagram of Defects in biotin (Btn) metabolism.png | 2025-05-14 16:58 | 3.1K | |
| Diagram of Defective pro-SFTPB causes pulmonary surfactant metabolism dysfunction 1 (SMDP1) resp.png | 2025-05-14 16:59 | 160K | |
| Diagram of Defective SLCO1B3 ca.png | 2025-05-14 16:59 | 790K | |
| Diagram of Defective SLC40A1 causes hemochromatosis 4 (HFE4) (m.png | 2025-05-14 16:56 | 427K | |
| Diagram of Defective SLC35A1 causes congenital disorder .png | 2025-05-14 16:57 | 142K | |
| Diagram of Defective SLC34A2 causes pulmonary alveolar microlithiasis (PALM).png | 2025-05-14 16:57 | 160K | |
| Diagram of Defective SLC33A1 causes spastic paraple.png | 2025-05-14 16:56 | 181K | |
| Diagram of Defective SLC29A3 causes histiocytosis-lymphadenopathy plus syndrome (HLAS).png | 2025-05-14 16:55 | 181K | |
| Diagram of Defective SLC27A4 causes ichthyosis prematurity syndrome (IPS).png | 2025-05-14 17:00 | 181K | |
| Diagram of Defective SLC24A1 causes congenital stationary night blindness 1D (CSNB1D).png | 2025-05-14 16:59 | 375K | |
| Diagram of Defective SLC17A5 causes Salla disease (SD) ISSD.png | 2025-05-14 16:57 | 142K | |
| Diagram of Defective SLC16A1 causes symptomatic deficiency in lactate transport (.png | 2025-05-14 16:58 | 456K | |
| Diagram of Defective SLC12A6 causes agenesis of the corpus callosum.png | 2025-05-14 16:58 | 587K | |
| Diagram of Defective SLC12A3 causes Gitelman syndrome (GS).png | 2025-05-14 16:57 | 587K | |
| Diagram of Defective SLC12A1 causes Bartter syndrome 1 (BS1).png | 2025-05-14 16:56 | 587K | |
| Diagram of Defective SLC11A2 causes hypochromic microcytic anemia.png | 2025-05-14 16:56 | 427K | |
| Diagram of Defective SFTPA2 causes idiopathic pulmonary fibrosis (IPF).png | 2025-05-14 16:57 | 160K | |
| Diagram of Defective RHAG causes regulator type Rh-null hemolytic anemia (RHN).png | 2025-05-14 16:58 | 456K | |
| Diagram of Defective NEU1 causes sialidosis.png | 2025-05-14 16:58 | 142K | |
| Diagram of Defective Mismatch Repair Associated With MSH6.png | 2025-05-14 16:59 | 89K | |
| Diagram of Defective Mismatch Repair Associated With MSH3.png | 2025-05-14 16:57 | 89K | |
| Diagram of Defective Mismatch Repair Associated With MSH2.png | 2025-05-14 17:00 | 89K | |
| Diagram of Defective Mismatch Repair Associated With MLH1.png | 2025-05-14 16:55 | 89K | |
| Diagram of Defective Mismatch Repair .png | 2025-05-14 17:00 | 89K | |
| Diagram of Defective HK1 causes h.png | 2025-05-14 16:59 | 91K | |
| Diagram of Defective GNE causes sialuria.png | 2025-05-14 16:56 | 142K | |
| Diagram of Defective GIF causes intrins.png | 2025-05-14 16:59 | 593K | |
| Diagram of Defective GGT1 c.png | 2025-05-14 16:58 | 767K | |
| Diagram of Defective GFPT1 causes C.png | 2025-05-14 16:55 | 595K | |
| Diagram of Defective GCLC causes Hemolytic anemia due to gamma-glutamylcysteine synthetase deficiency (HAGGSD).png | 2025-05-14 17:00 | 767K | |
| Diagram of Defective GCK causes maturity-onset diabetes of the young 2 (MODY2).png | 2025-05-14 16:59 | 91K | |
| Diagram of Defective GALNT12 causes colorectal cancer 1 (CRCS1).png | 2025-05-14 17:00 | 178K | |
| Diagram of Defective GALNT3 causes familial hyperphosphatemic tumoral calcinosis (HFTC).png | 2025-05-14 16:58 | 178K | |
| Diagram of Defective DPAGT1 causes DPAGT1-CDG (CDG-1j) CMSTA2.png | 2025-05-14 17:00 | 595K | |
| Diagram of Defective CYP27A1 causes Cerebrotendinous xanthomatosis (CTX).png | 2025-05-14 16:57 | 790K | |
| Diagram of Defective CYP11B2 causes Corticosterone methyloxida.png | 2025-05-14 16:59 | 1.2M | |
| Diagram of Defective CYP11B1 causes Adrenal hyperplasia 4 (AH4).png | 2025-05-14 16:57 | 1.2M | |
| Diagram of Defective CYP11A1 causes Adrenal insufficiency.png | 2025-05-14 17:00 | 1.2M | |
| Diagram of Defective CUBN causes hereditary megaloblastic anemia 1.png | 2025-05-14 17:00 | 593K | |
| Diagram of Defective CP causes aceruloplasminemia (ACERULOP).png | 2025-05-14 16:58 | 427K | |
| Diagram of Defective CFTR causes cystic fibrosis.png | 2025-05-14 16:56 | 236K | |
| Diagram of Defective CD320 causes methylmalonic aciduria.png | 2025-05-14 16:58 | 593K | |
| Diagram of Defective C1GALT1C1 causes Tn polyagglutination syndrome (TNPS).png | 2025-05-14 16:58 | 178K | |
| Diagram of Defective B3GALTL c.png | 2025-05-14 16:56 | 178K | |
| Diagram of Defective AVP causes neurohypophyseal diabetes insipidus (NDI).png | 2025-05-14 16:59 | 1.2M | |
| Diagram of Defective AMN causes hereditary megaloblastic anemia 1.png | 2025-05-14 16:55 | 593K | |
| Diagram of Defective ALG11 causes ALG11-CDG (CDG-1p).png | 2025-05-14 16:58 | 595K | |
| Diagram of Defective ALG2 causes ALG2-CDG (CDG-1i).png | 2025-05-14 16:59 | 595K | |
| Diagram of Defective ALG1 causes ALG1-CDG (CDG-1k).png | 2025-05-14 16:59 | 595K | |
| Diagram of Defective AHCY causes Hypermethioninemia with S-adenosylhomocysteine hydrolase deficiency (HMAHCHD).png | 2025-05-14 16:58 | 767K | |
| Diagram of Defective ACTH causes Obesity Pro-opiomelanocortinin deficiency (POMCD).png | 2025-05-14 16:55 | 1.2M | |
| Diagram of Defective ABCC2 causes.png | 2025-05-14 16:58 | 236K | |
| Diagram of Defective ABCB11 causes progressive familial intrahepatic cholestasis 2 benign recurrent intrahepatic cholestasis 2.png | 2025-05-14 17:00 | 790K | |
| Diagram of Defective ABCB4 causes progressive familial intrahepatic cholestasis 3.png | 2025-05-14 16:57 | 236K | |
| Diagram of Death Receptor Signalling and Papillomavirus Host Interactions.png | 2025-05-14 16:59 | 5.2K | |
| Diagram of Deadenylation-dependent mRNA decay.png | 2025-05-14 16:58 | 115K | |
| Diagram of DSCAM interactions.png | 2025-05-14 17:00 | 29K | |
| Diagram of DNA methylation.png | 2025-05-14 16:56 | 36K | |
| Diagram of DNA Replication.png | 2025-05-14 16:56 | 3.8K | |
| Diagram of DNA Repair.png | 2025-05-14 16:57 | 6.1K | |
| Diagram of DNA Double Strand Break Response.png | 2025-05-14 16:55 | 382K | |
| Diagram of DNA Double-Strand Break Repair.png | 2025-05-14 16:57 | 9.0K | |
| Diagram of DNA Damage Reversal.png | 2025-05-14 16:58 | 112K | |
| Diagram of DNA Damage Bypass.png | 2025-05-14 16:56 | 271K | |
| Diagram of DNA Damage-Telomere Stress Induced Senescence.png | 2025-05-14 16:56 | 152K | |
| Diagram of DAP12 interactions.png | 2025-05-14 16:58 | 216K | |
| Diagram of DAG and IP3 signaling.png | 2025-05-14 16:57 | 107K | |
| Diagram of Cytosolic sensors of pathogen-associated DNA .png | 2025-05-14 16:56 | 290K | |
| Diagram of Cytosolic iron-sulfur cluster assembly.png | 2025-05-14 16:59 | 51K | |
| Diagram of Cytokine Signaling in Immune system.png | 2025-05-14 16:55 | 7.1K | |
| Diagram of Costimulation by the CD28 family.png | 2025-05-14 16:56 | 264K | |
| Diagram of Constitutive Signaling by Aberrant PI3K in Cancer.png | 2025-05-14 16:59 | 360K | |
| Diagram of Constitutive Signaling by AKT1 E17K in Cancer.png | 2025-05-14 16:56 | 360K | |
| Diagram of Complement cascade.png | 2025-05-14 16:59 | 439K | |
| Diagram of Collagen formation.png | 2025-05-14 16:59 | 2.9K | |
| Diagram of Collagen degradation.png | 2025-05-14 16:57 | 316K | |
| Diagram of Collagen biosynthesis and modifying enzymes.png | 2025-05-14 16:57 | 96K | |
| Diagram of Class I MHC mediated antigen processing & presentation.png | 2025-05-14 17:00 | 303K | |
| Diagram of Circadian Clock.png | 2025-05-14 16:56 | 246K | |
| Diagram of Chromosome Maintenance.png | 2025-05-14 16:56 | 2.1K | |
| Diagram of Chromatin organization.png | 2025-05-14 16:57 | 1.8K | |
| Diagram of Chromatin modifying enzymes.png | 2025-05-14 16:58 | 808K | |
| Diagram of Cholesterol biosynthesis.png | 2025-05-14 16:59 | 280K | |
| Diagram of Cellular response to hypoxia.png | 2025-05-14 16:57 | 2.1K | |
| Diagram of Cellular response to heat stress.png | 2025-05-14 17:00 | 170K | |
| Diagram of Cellular responses to stress.png | 2025-05-14 17:00 | 5.8K | |
| Diagram of Cellular Senescence.png | 2025-05-14 16:59 | 16K | |
| Diagram of Cell surface interactions at the vascular wall.png | 2025-05-14 16:58 | 299K | |
| Diagram of Cell junction organization.png | 2025-05-14 17:01 | 217K | |
| Diagram of Cell Cycle Checkpoints.png | 2025-05-14 16:59 | 392K | |
| Diagram of Cell Cycle.png | 2025-05-14 16:57 | 2.8K | |
| Diagram of Cell Cycle, Mitotic.png | 2025-05-14 16:59 | 12K | |
| Diagram of Cell-Cell communication.png | 2025-05-14 16:58 | 6.0K | |
| Diagram of Caspase activation via extrinsic apoptotic signalig pathway.png | 2025-05-14 16:58 | 15K | |
| Diagram of Caspase-8 activation by cleavage.png | 2025-05-14 16:59 | 75K | |
| Diagram of Cargo concentration in the ER.png | 2025-05-14 17:00 | 103K | |
| Diagram of Cardiac conduction.png | 2025-05-14 16:59 | 168K | |
| Diagram of C-type lectin receptors (CLRs).png | 2025-05-14 16:56 | 409K | |
| Diagram of Branched-chain amino acid catabolism.png | 2025-05-14 16:56 | 188K | |
| Diagram of Biological oxidations.png | 2025-05-14 16:59 | 6.6K | |
| Diagram of Binding and Uptake of Ligands by Scavenger Receptors.png | 2025-05-14 16:59 | 152K | |
| Diagram of Bile acid bile salt metabolism.png | 2025-05-14 16:56 | 790K | |
| Diagram of Bile acid and bile salt metabolism, Defective ABCB11 causes progressive familial intrahepatic cholestasis 2 and benign recurrent intrahepatic cholestasis 2, Defective CYP27A1 causes Cerebrotendinous xanthomatosis (CTX), Defective SLCO1B3 ca.png | 2025-05-14 16:57 | 790K | |
| Diagram of Beta-catenin independent WNT signaling.png | 2025-05-14 17:00 | 375K | |
| Diagram of Base Excision Repair.png | 2025-05-14 16:57 | 2.8K | |
| Diagram of Base-Excision Repair.png | 2025-05-14 16:56 | 186K | |
| Diagram of Base-Excision Repair, AP Site Formation.png | 2025-05-14 16:56 | 186K | |
| Diagram of BMAL1_CLOCK,NPAS2 activates circadian gene expression.png | 2025-05-14 16:57 | 204K | |
| Diagram of B-WICH complex positively regulates rRNA expression.png | 2025-05-14 16:57 | 42K | |
| Diagram of Axon guidance.png | 2025-05-14 16:56 | 7.0K | |
| Diagram of Assembly of the primary cilium.png | 2025-05-14 16:58 | 407K | |
| Diagram of Assembly of collagen fibrils and other multimeric structures.png | 2025-05-14 16:57 | 173K | |
| Diagram of Asparagine N-linked glycosylation.png | 2025-05-14 16:56 | 595K | |
| Diagram of Asparagine N-linked glycosylation, Defective ALG1 causes ALG1-CDG (CDG-1k), Defective ALG11 causes ALG11-CDG (CDG-1p), Defective ALG2 causes ALG2-CDG (CDG-1i), Defective DPAGT1 causes DPAGT1-CDG (CDG-1j) and CMSTA2, Defective GFPT1 causes C.png | 2025-05-14 16:58 | 595K | |
| Diagram of Arachidonic acid Metabolism pathway.png | 2025-05-14 16:59 | 461K | |
| Diagram of Aquaporin-mediated transport.png | 2025-05-14 16:56 | 3.8K | |
| Diagram of Apoptotic execution phase.png | 2025-05-14 16:57 | 347K | |
| Diagram of Apoptosis.png | 2025-05-14 16:57 | 16K | |
| Diagram of Antiviral mechanism by IFN-stimulated genes.png | 2025-05-14 16:56 | 2.9K | |
| Diagram of Amyloids.png | 2025-05-14 16:59 | 137K | |
| Diagram of Amino acid synthesis and interconversion (transamination).png | 2025-05-14 16:57 | 183K | |
| Diagram of Amine-derived hormones.png | 2025-05-14 16:58 | 161K | |
| Diagram of Aflatoxin activation and detoxification and Defective ACY1 causes encephalopathy.png | 2025-05-14 16:56 | 113K | |
| Diagram of Advanced glycosylation endproduct receptor signaling.png | 2025-05-14 16:57 | 24K | |
| Diagram of Adaptive Immunity Signaling.png | 2025-05-14 17:00 | 11K | |
| Diagram of Activation of gene expression by SREBF (SREBP).png | 2025-05-14 16:57 | 360K | |
| Diagram of Activation of anterior HOX genes in hindbrain development during early embryogenesis.png | 2025-05-14 16:55 | 386K | |
| Diagram of Activation of Matrix Metalloproteinases.png | 2025-05-14 16:57 | 151K | |
| Diagram of Activation of HOX genes during differentiation.png | 2025-05-14 16:59 | 2.5K | |
| Diagram of Activated PKN1 stimulates transcription of AR (androgen receptor) regulated genes KLK2 and KLK3.png | 2025-05-14 16:59 | 103K | |
| Diagram of Abnormal conversion of 2-oxoglutarate to 2-hydroxyglutarate.png | 2025-05-14 16:58 | 12K | |
| Diagram of Abacavir transport and metabolism.png | 2025-05-14 17:00 | 78K | |
| Diagram of AXIN mutants destabilize the destruction complex.png | 2025-05-14 16:57 | 4.3K | |
| Diagram of AXIN mutants destabilize the destruction complex, activating WNT signaling.png | 2025-05-14 16:59 | 4.3K | |
| Diagram of ATP synthesis by chemiosmotic coupling.png | 2025-05-14 16:57 | 305K | |
| Diagram of ATF6-alpha activates chaperone genes.png | 2025-05-14 17:00 | 42K | |
| Diagram of ATF4 activates genes.png | 2025-05-14 16:59 | 47K | |
| Diagram of AP Site Formation.png | 2025-05-14 16:58 | 186K | |
| Diagram of APC-C-mediated degradation of cell cycle proteins.png | 2025-05-14 16:55 | 237K | |
| Diagram of AMER1 mutants destabilize the destruction complex.png | 2025-05-14 17:00 | 3.1K | |
| Diagram of ABC transporter disorders.png | 2025-05-14 16:56 | 27K | |
| Diagram of ABC-family proteins mediated transport.png | 2025-05-14 16:57 | 236K | |
| Diagram of ABC-family proteins mediated transport, Defective ABCB4 causes progressive familial intrahepatic cholestasis 3, intrahepatic cholestasis of pregnancy 3 and gallbladder disease 1, Defective CFTR causes cystic fibrosis, Defective ABCC2 causes.png | 2025-05-14 16:56 | 236K | |
| Diagram of 24.png | 2025-05-14 17:00 | 26K | |
| Diagram of 5 GM-CSF signaling.png | 2025-05-14 16:59 | 320K | |
|
|---|
.png)
.png)
%20signaling%20pathways.png)
%20%20dRTA%20with%20hemolytic%20anemia%20(dRTA-HA).png)
%20and%20linoleic%20(omega6)%20acid%20metabolism.png)
-stimulated%20gene%20expression.png)
%20activates%20chaperone%20genes.png)
%20metabolism.png)
.png)
.png)
,%20Defective%20SLC29A3%20causes%20histiocytosis-lymphadenopathy%20plus%20syndrome%20(HLAS),%20Defective%20SLC33A1%20causes%20spastic%20paraple.png)
,%20Defective%20SLC12A3%20causes%20Gitelman%20syndrome%20(GS),%20Defective%20SLC12A6%20causes%20agenesis%20of%20the%20corpus%20callosum,%20with%20peripher.png)
,%20Defective%20SLC16A1%20causes%20symptomatic%20deficiency%20in%20lactate%20transport%20(.png)
%20Cascade%20and%20TLR3%20deficiency%20-%20HSE.png)
.png)
%20cycle%20and%20respiratory%20electron%20transport.png)
%20(via%20TLR).png)
.png)
,%20Defective%20SFTPA2%20causes%20idiopathic%20pulmonary%20fibrosis%20(IPF),%20Defective%20pro-SFTPB%20causes%20pulmonary%20surfactant%20metabolism%20dysfunction%201%20(SMDP1)%20and%20resp.png)
%20family%20interactions.png)
.png)
.png)
(NOTCH1_M1580_K2555)%20Translocation%20Mutant.png)
(NOTCH1_M1580_K2555)%20Translocation%20Mutant,%20Signaling%20by%20NOTCH1%20HD%20Domain%20Mutants%20in%20Cancer,%20FBXW7%20Mutants%20and%20NOTCH1%20in%20Cancer,%20%20and%20Signaling.png)
%20and%20ISSD,%20Defective%20NEU1%20causes%20sialidosis,%20Defective%20GNE%20causes%20sialuria,%20Nonaka%20myopathy%20and%20inclusion%20body%20myopathy%202,%20%20and%20Defective%20SLC35A1%20causes%20congenital%20disorder%20.png)
.png)
.png)
.png)
.png)
.png)
%20transport%20and%20uptake%20by%20Insulin-like%20Growth%20Factor%20Binding%20Proteins%20(IGFBPs).png)
%20by%20oxygen.png)
.png)
,%20Defective%20GCLC%20causes%20Hemolytic%20anemia%20due%20to%20gamma-glutamylcysteine%20synthetase%20deficiency%20(HAGGSD),%20Defective%20GGT1%20c.png)
,%20Defective%20CYP11B1%20causes%20Adrenal%20hyperplasia%204%20(AH4),%20Defective%20CYP11B2%20causes%20Corticosterone%20methyloxida.png)
.png)
,%20SOX2,%20NANOG%20repress%20genes%20related%20to%20differentiation.png)
,%20SOX2,%20NANOG%20activate%20genes%20related%20to%20proliferation.png)
,%20Defective%20GALNT3%20causes%20familial%20hyperphosphatemic%20tumoral%20calcinosis%20(HFTC),%20Defective%20GALNT12%20causes%20colorectal%20cancer%201%20(CRCS1),%20Defective%20B3GALTL%20c.png)
%20signaling%20pathways.png)
.png)
.png)
.png)
.png)
%20represses%20gene%20expression.png)
.png)
.png)
,%20%20and%20IRAK4%20deficiency%20(TLR5).png)
,%20%20and%20IRAK4%20deficiency%20(TLR2-4).png)
,%20Glycogen%20storage%20disease%20type%200%20(liver%20GYS2),%20Glycogen%20storage%20disease%20type%20II%20(GAA),%20Glycogen%20storage%20disease%20type%20IV%20(GBE1),%20Glycogen%20storage%20disease%20type%20XV%20(GYG.png)
-dependent%20MAPK1-3%20activation.png)
,%20Defective%20SLC11A2%20causes%20hypochromic%20microcytic%20anemia,%20with%20iron%20overload%201%20(AHMIO1),%20Defective%20SLC40A1%20causes%20hemochromatosis%204%20(HFE4)%20(m.png)
.png)
.png)
%20bind%20RNA.png)
.png)
.png)
%20(via%20TLR).png)
,%20Glycogen%20storage%20disease%20type%20Ib%20(SLC37A4),%20Severe%20congenital%20neutropenia%20type%204%20(G6PC3),%20Defective%20GCK%20causes%20maturity-onset%20diabetes%20of%20the%20young%202%20(MODY2),%20Defective%20HK1%20causes%20h.png)
.png)
%20or%20Single%20Strand%20Annealing%20(SSA).png)
.png)
.png)
.png)
.png)
.png)
.png)
,%20%20and%20Defective%20AVP%20causes%20neurohypophyseal%20diabetes%20insipidus%20(NDI).png)
.png)
%20dependent%20phagocytosis.png)
%20signaling.png)
.png)
,%20%20distal%20renal%20tubular%20acidosis%20(dRTA)%20and%20dRTA%20with%20hemolytic%20anemia%20(dRTA-HA).png)
.png)
%20Mediated%20Vesicle%20Transport.png)
%20and%20EHMT2%20(G9a)%20positively%20regulate%20rRNA%20expression.png)
%20metabolism.png)
%20metabolism.png)
%20%20resp.png)
%20(m.png)
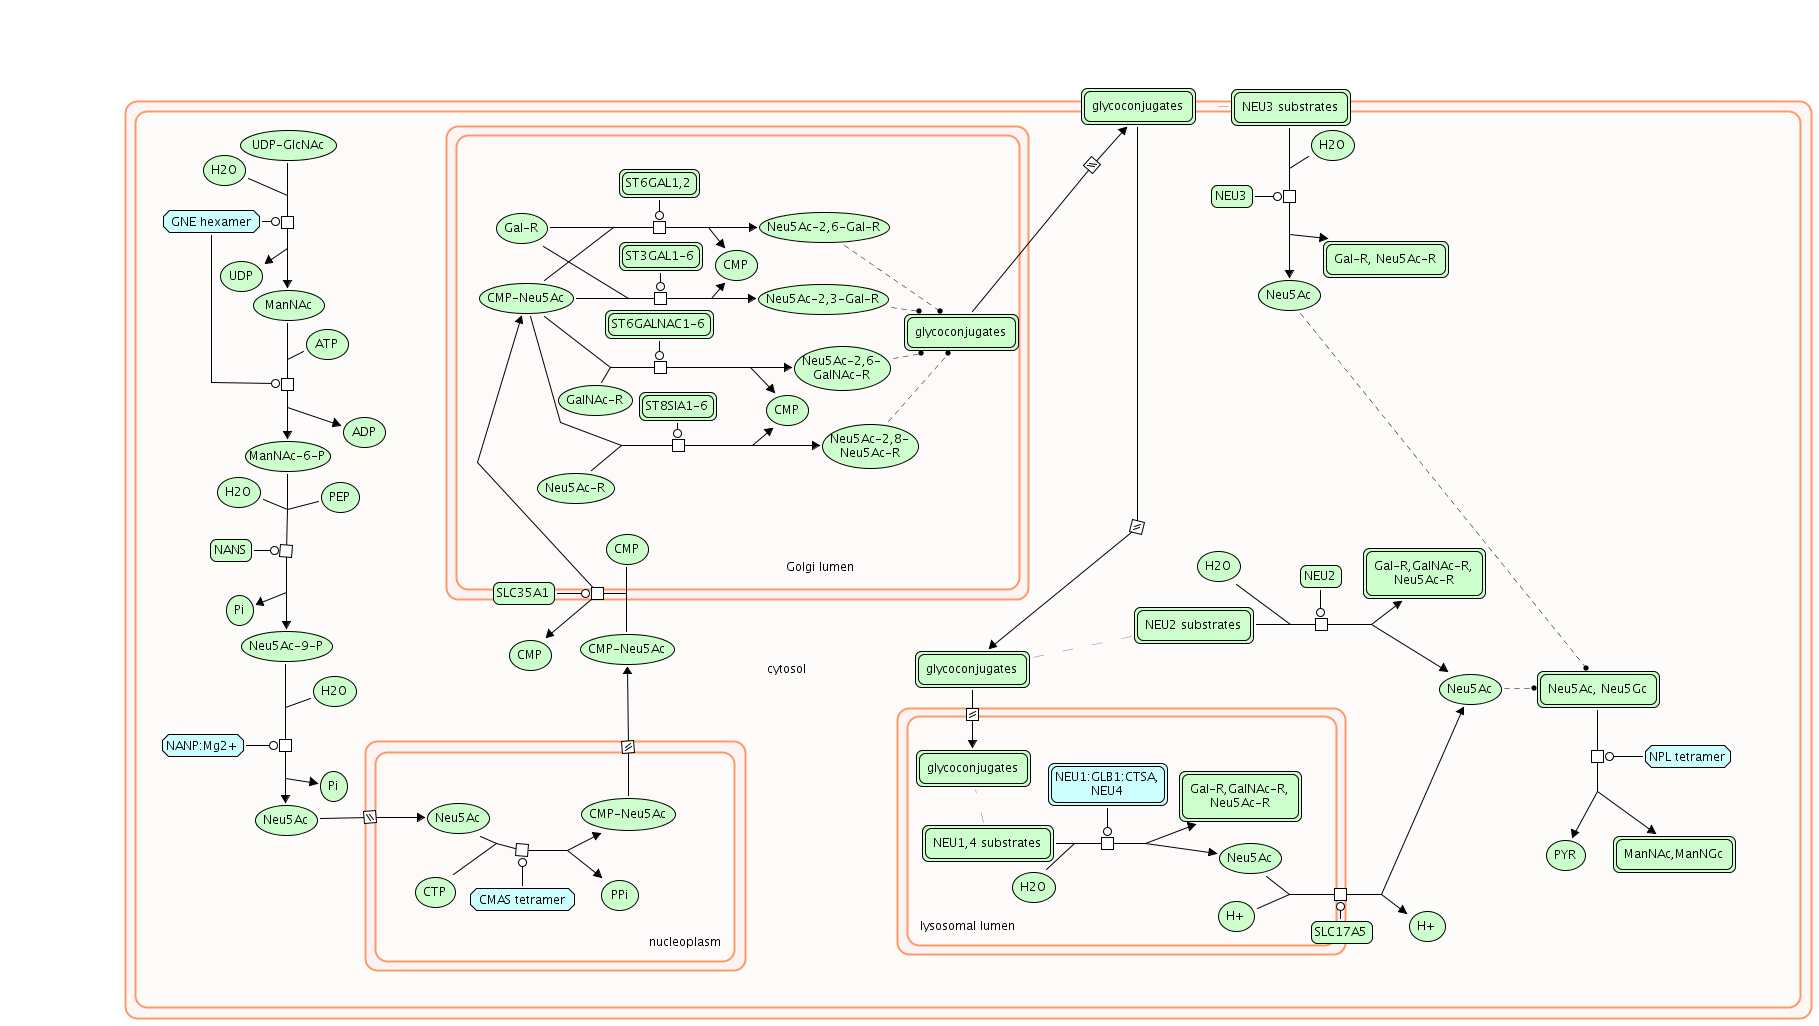
.png)
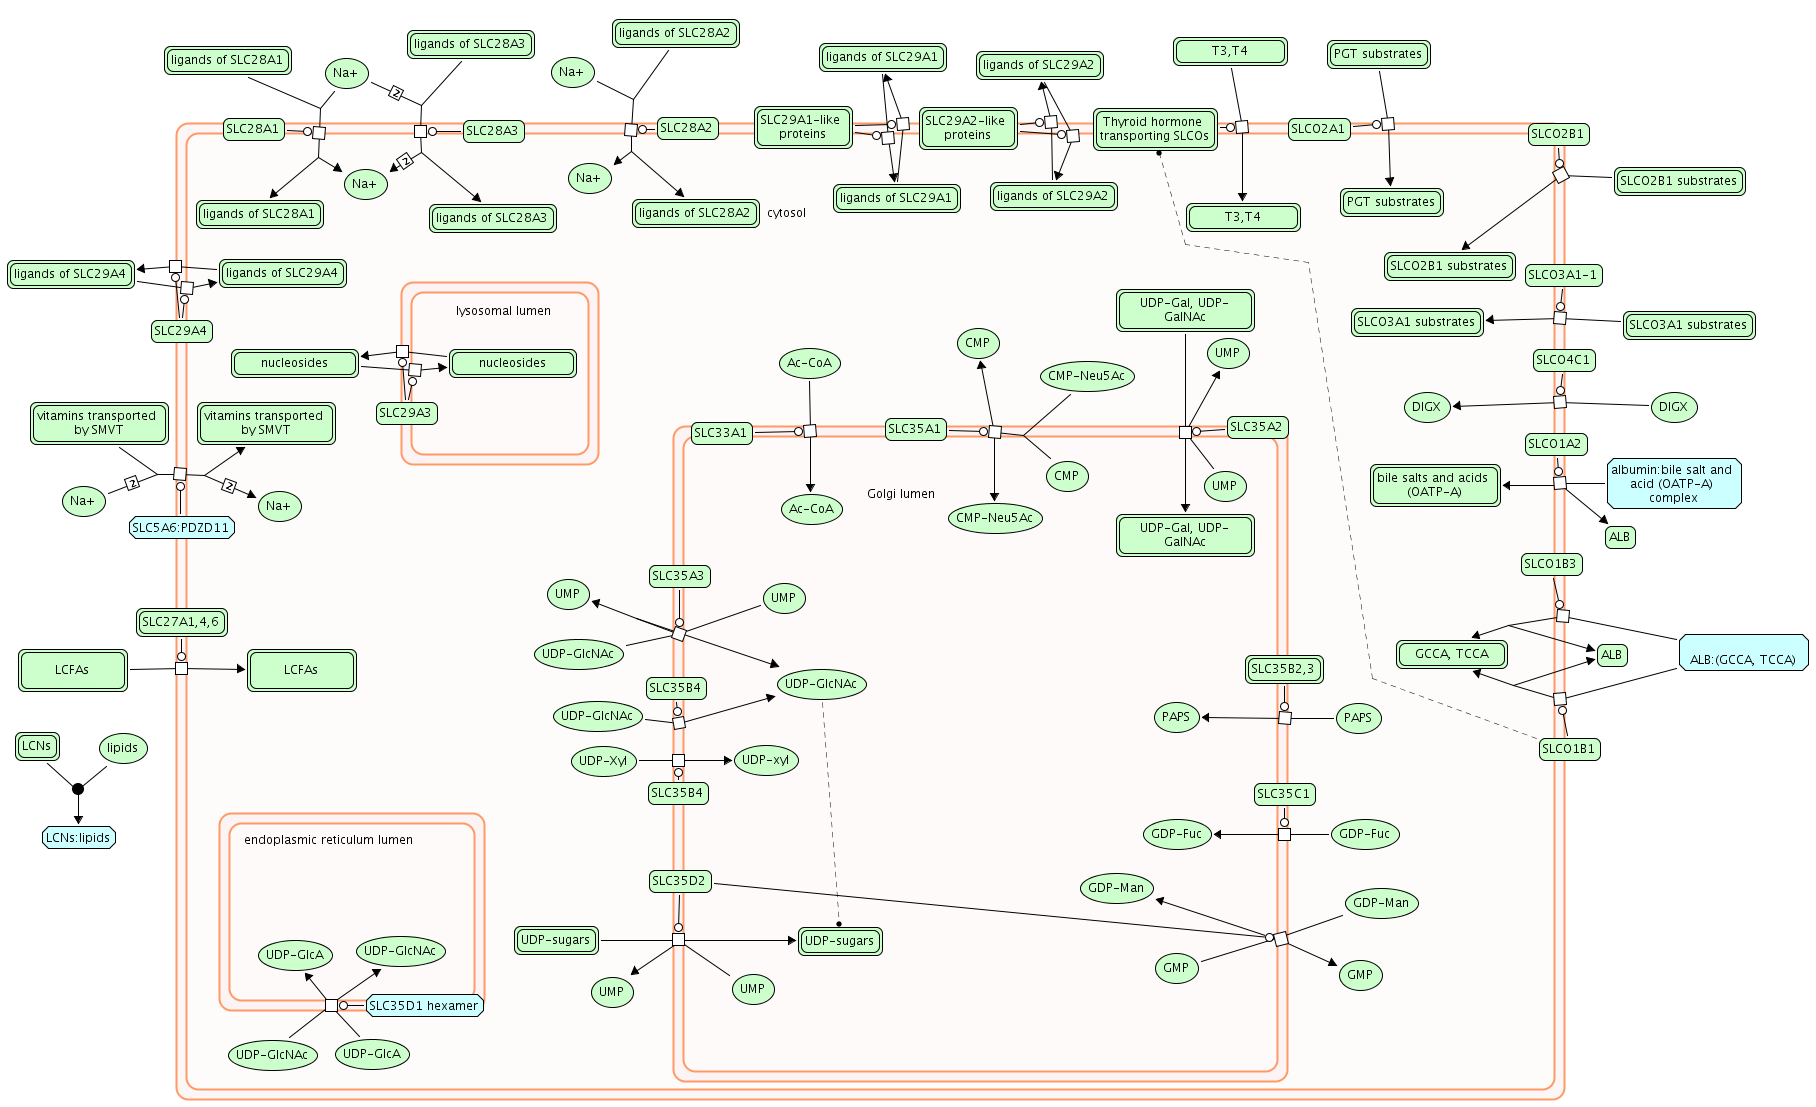
.png)
.png)
.png)
%20%20ISSD.png)
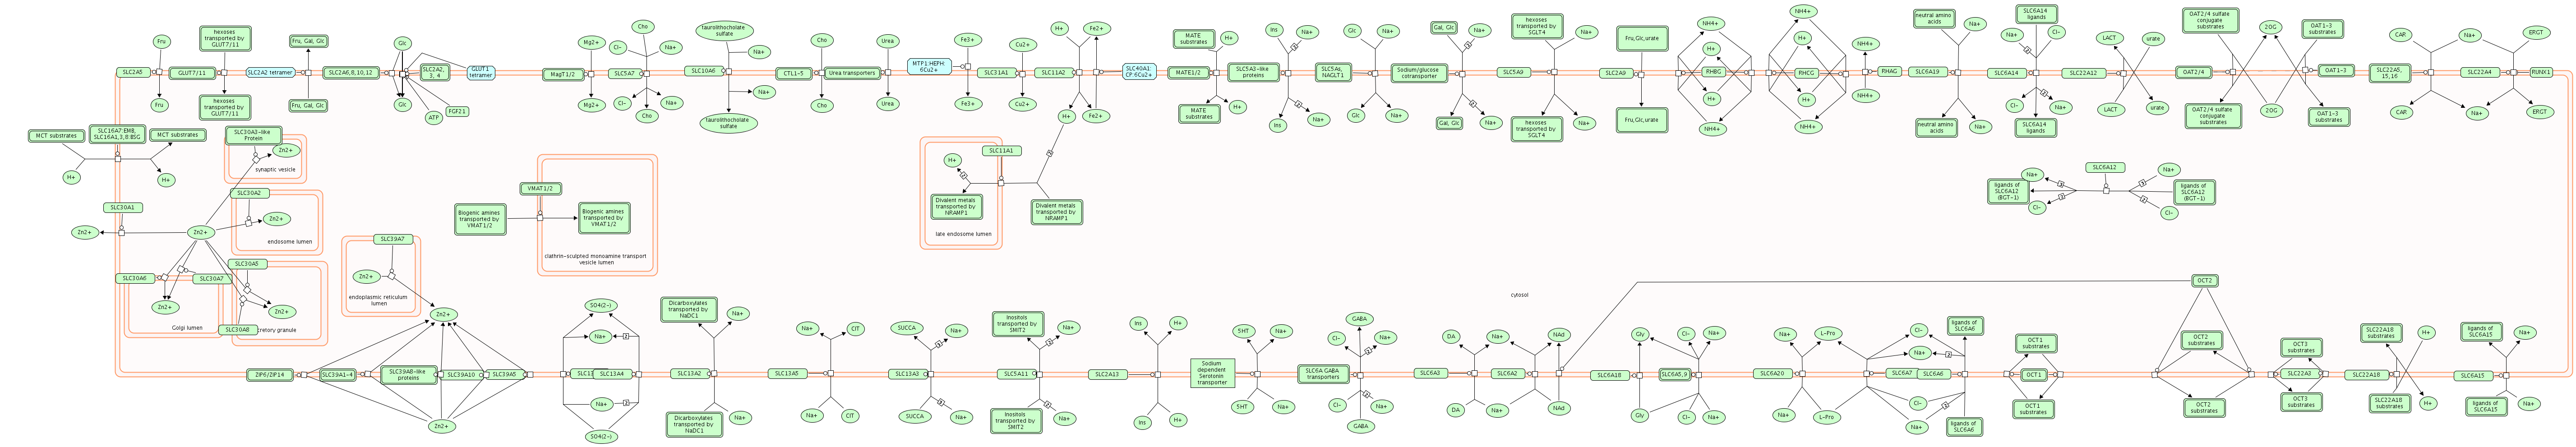
.png)
.png)
.png)
.png)
.png)
.png)
.png)
.png)
%20%20CMSTA2.png)
.png)
.png)
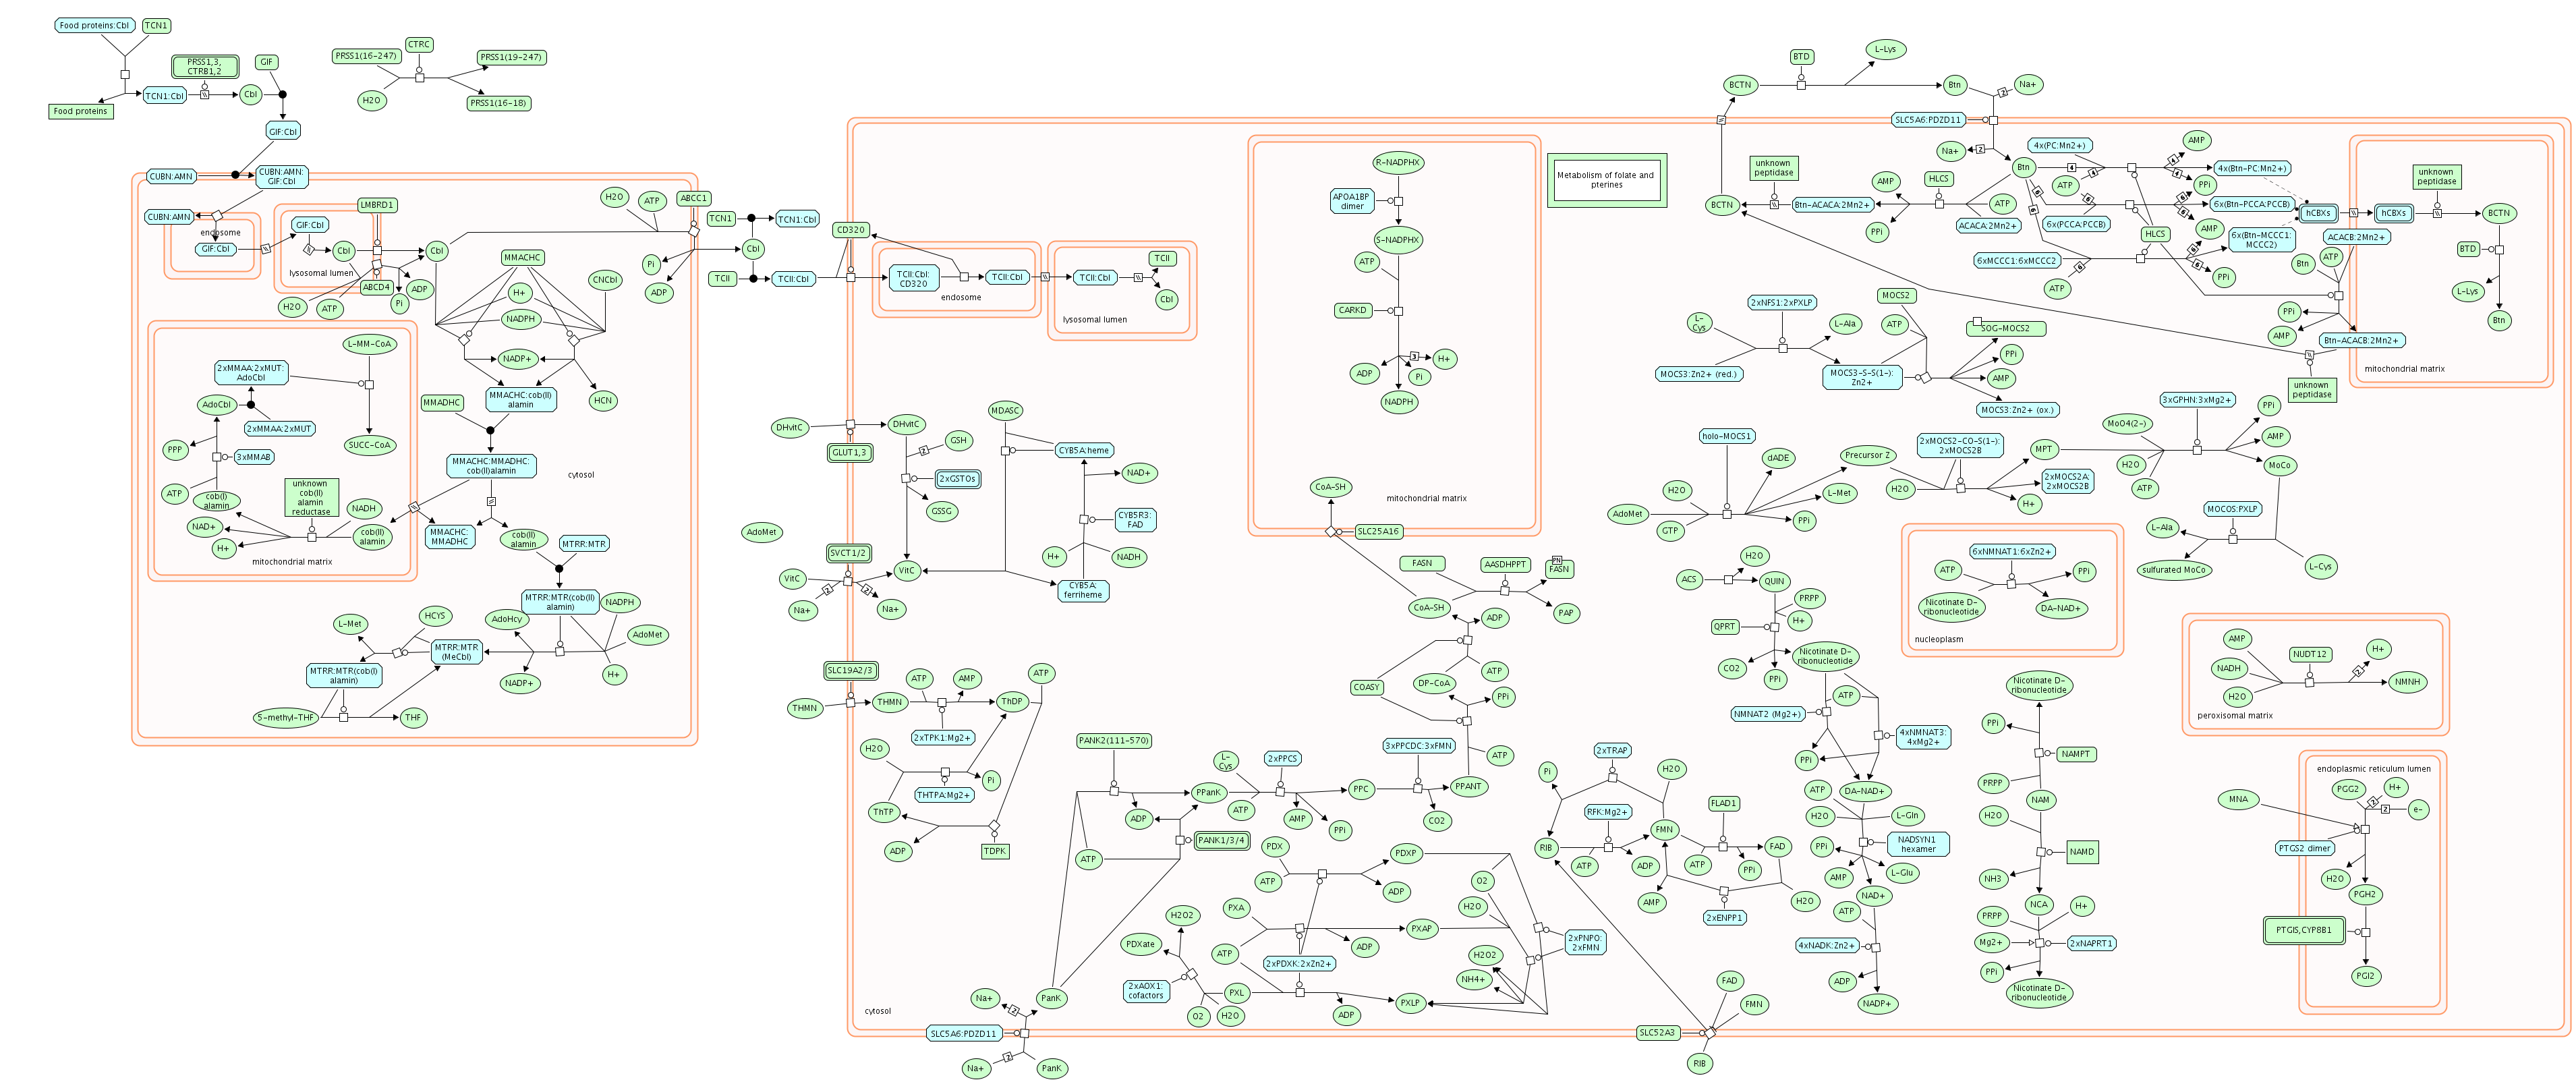
.png)
.png)
.png)
.png)
.png)
.png)
.png)
.png)
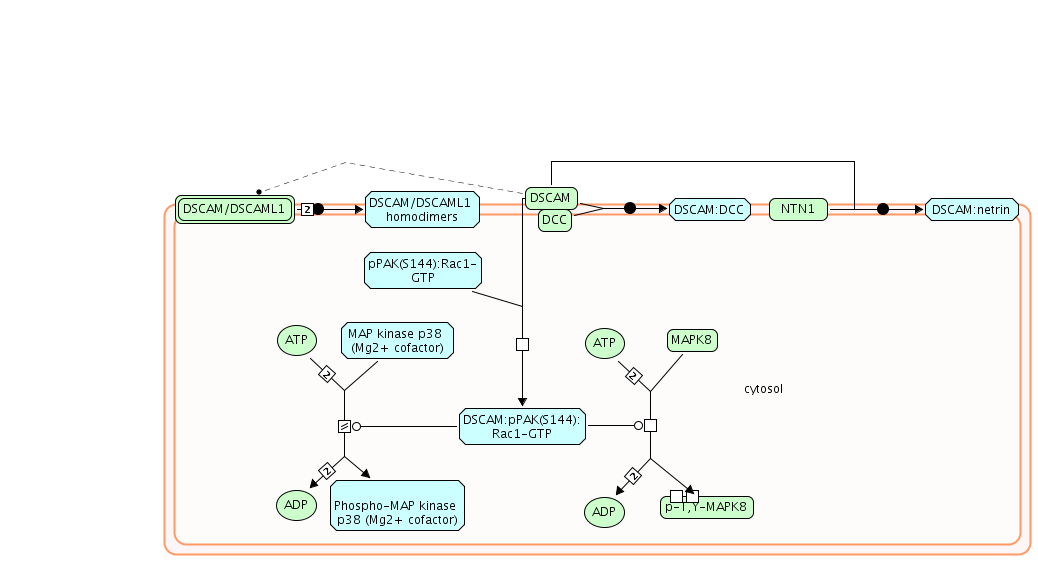
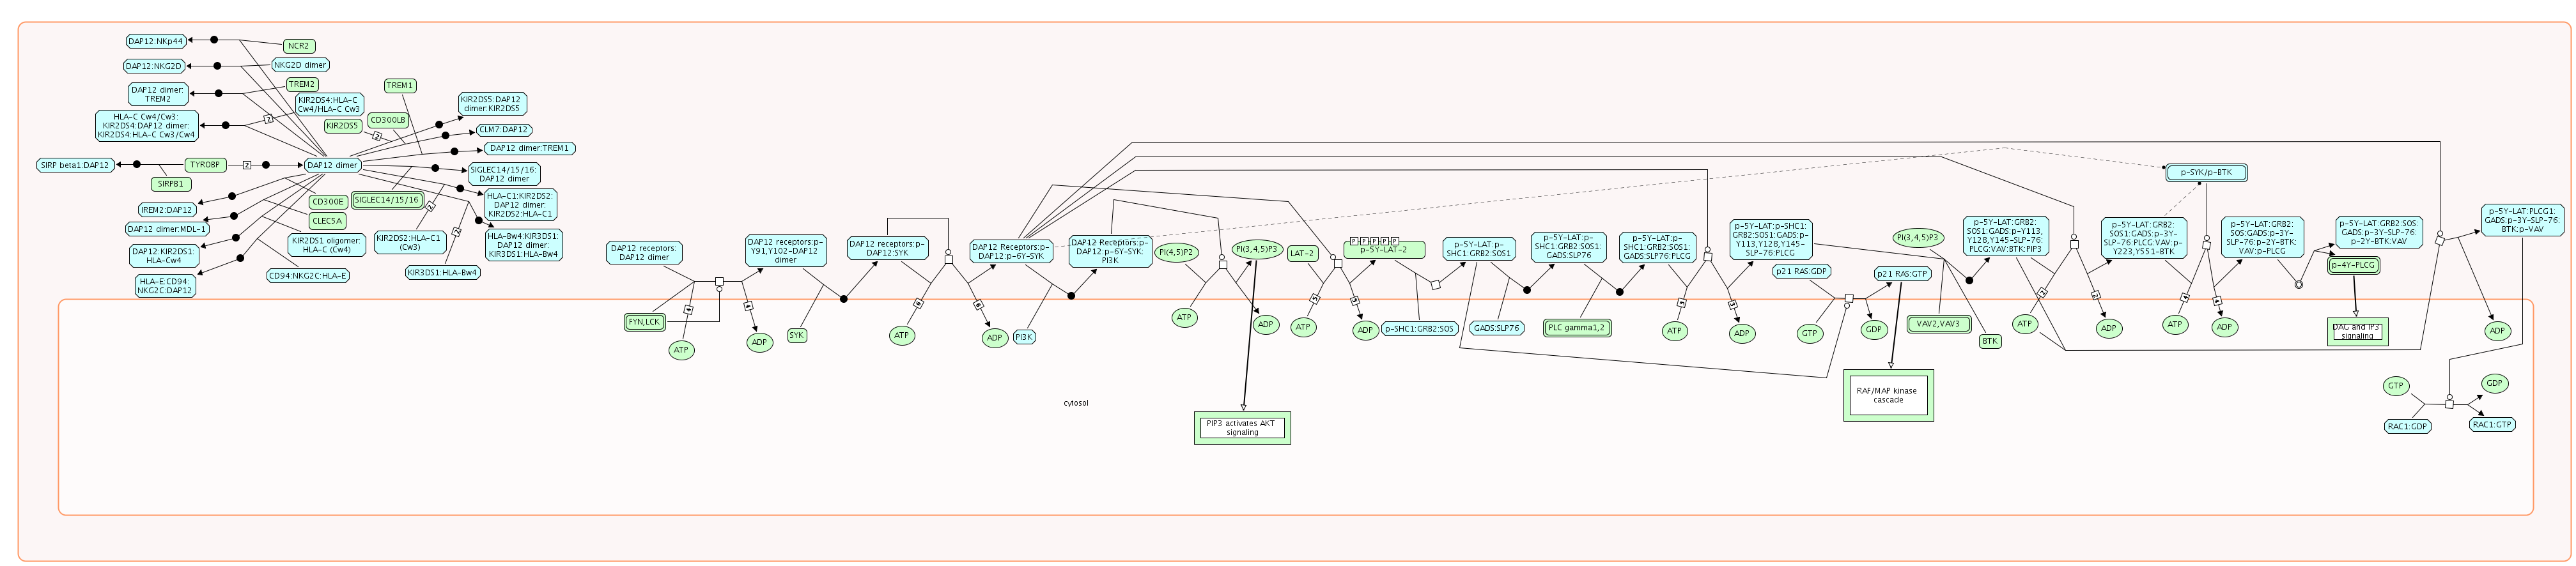
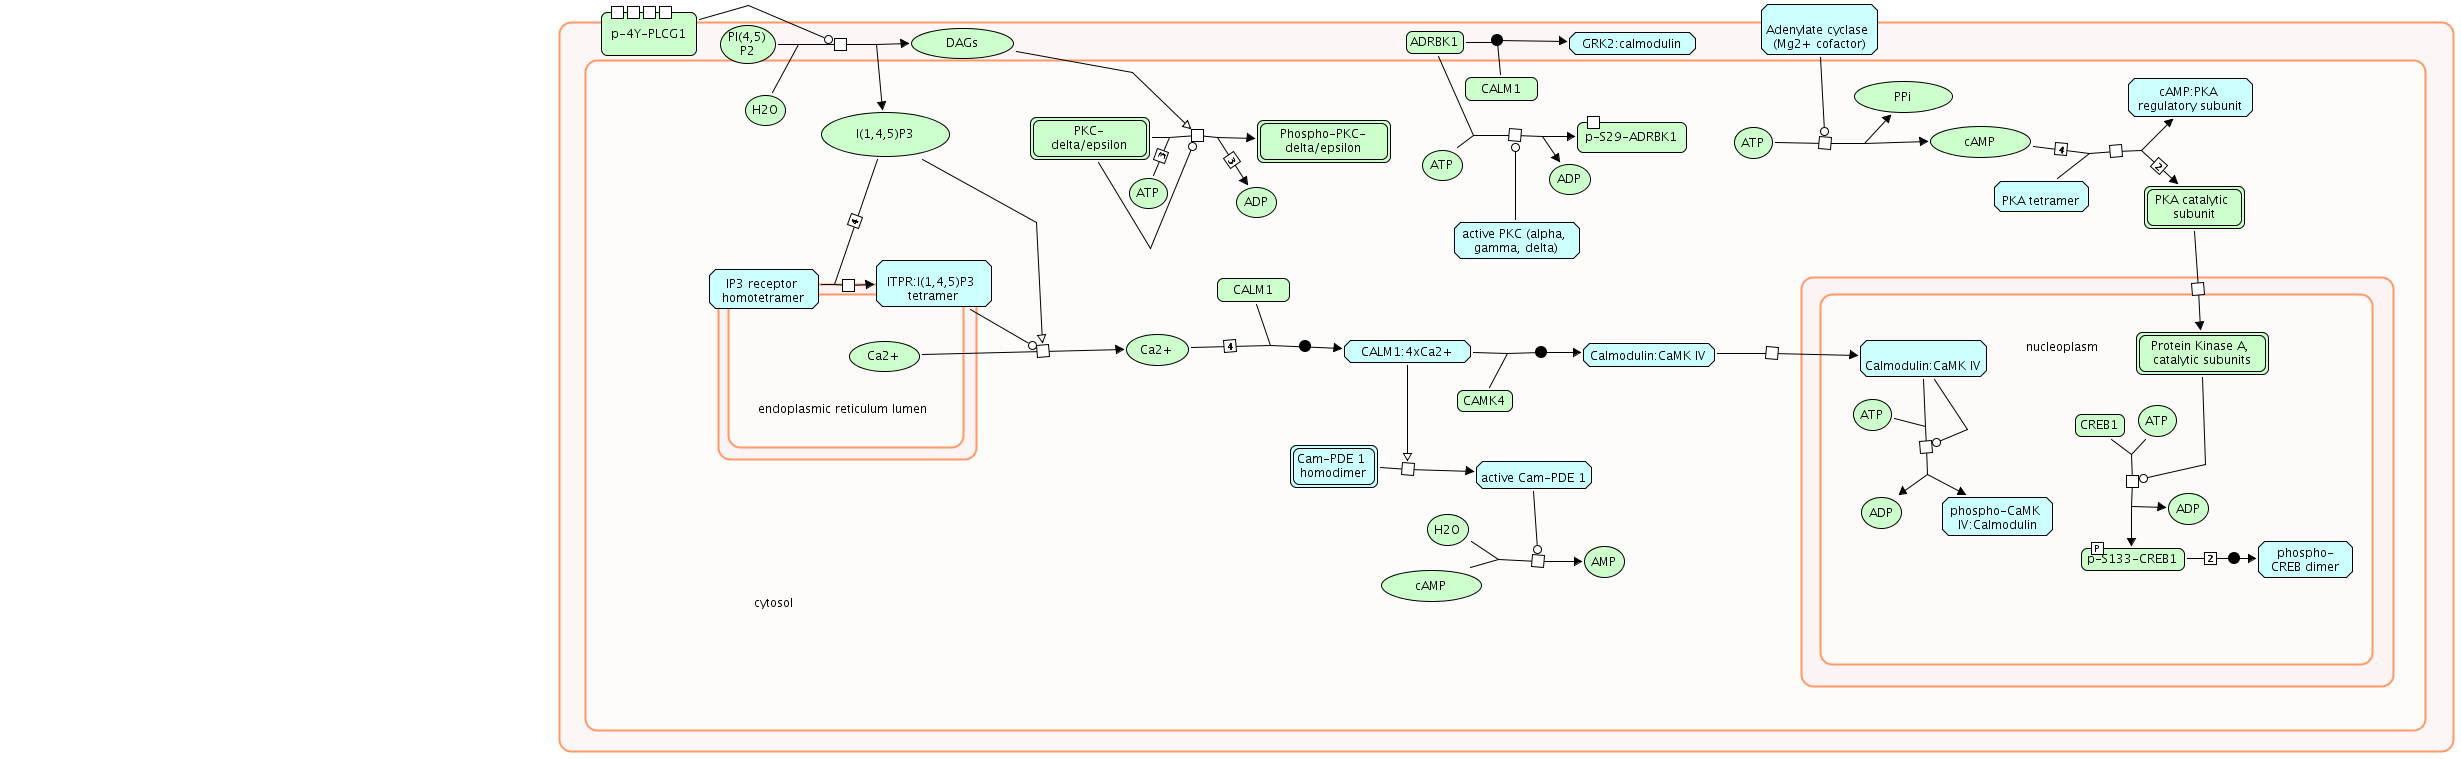
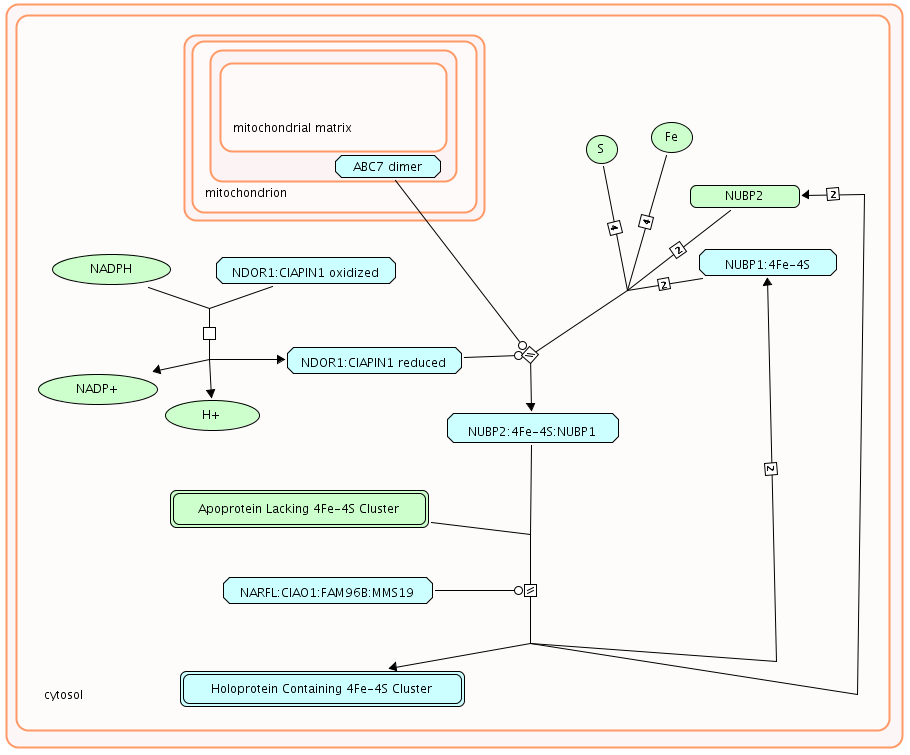
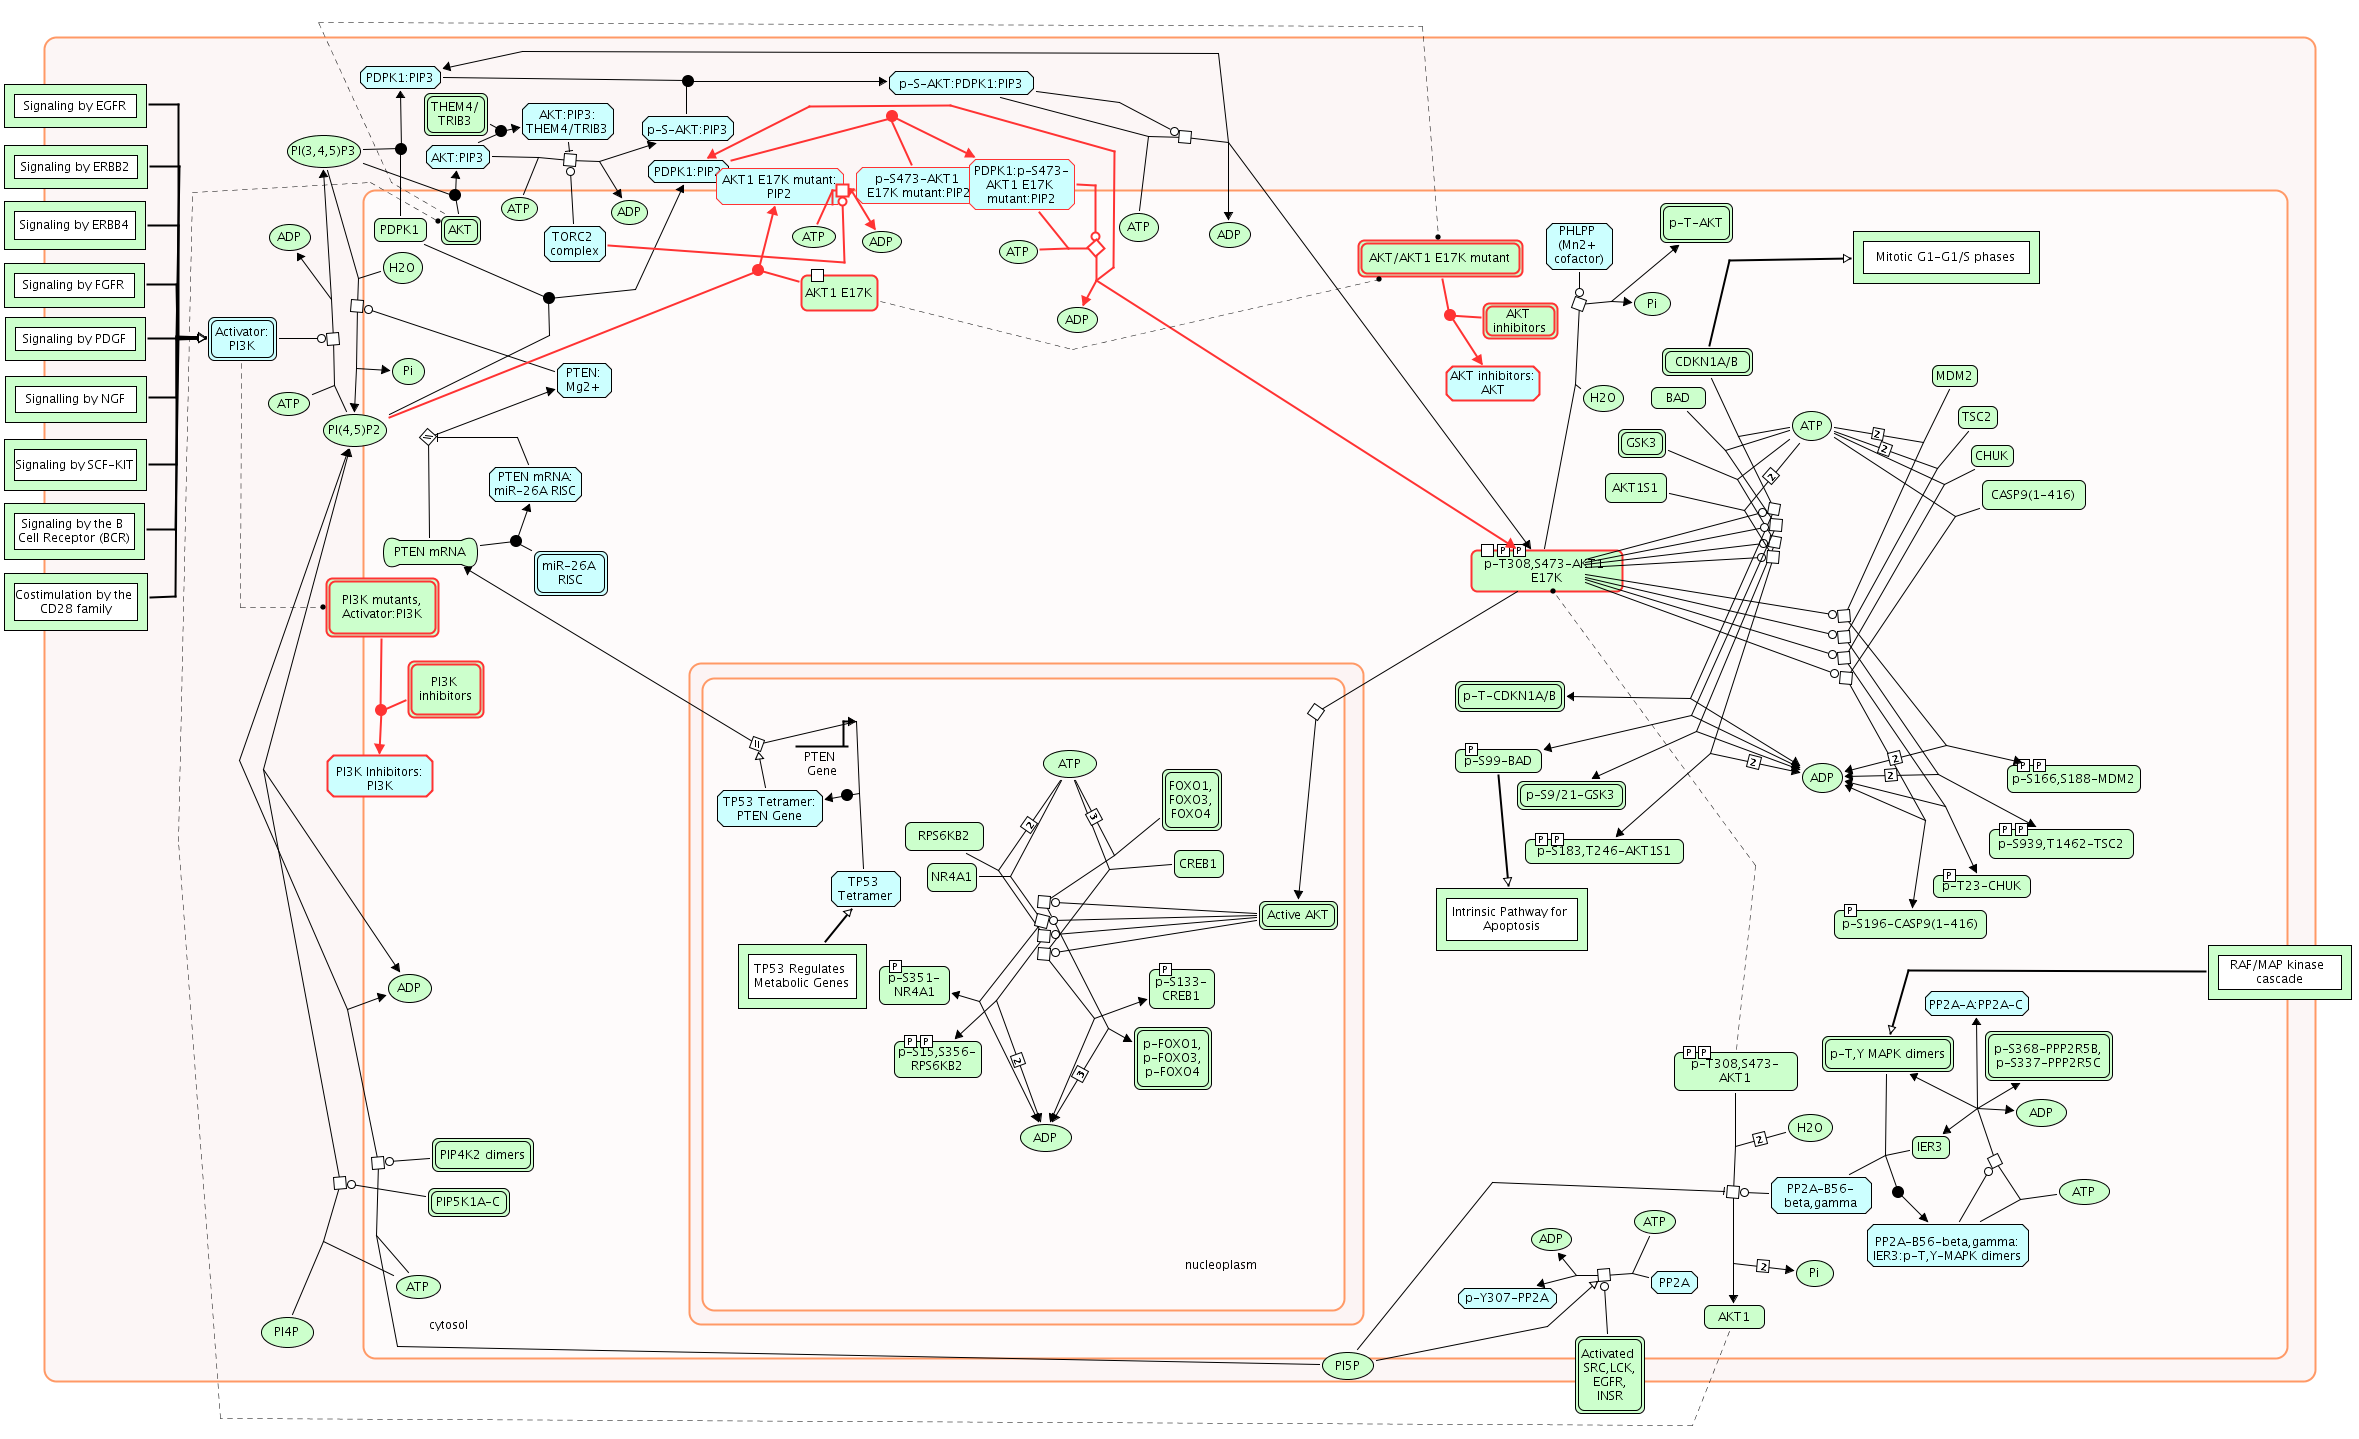
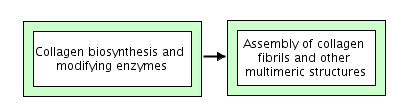
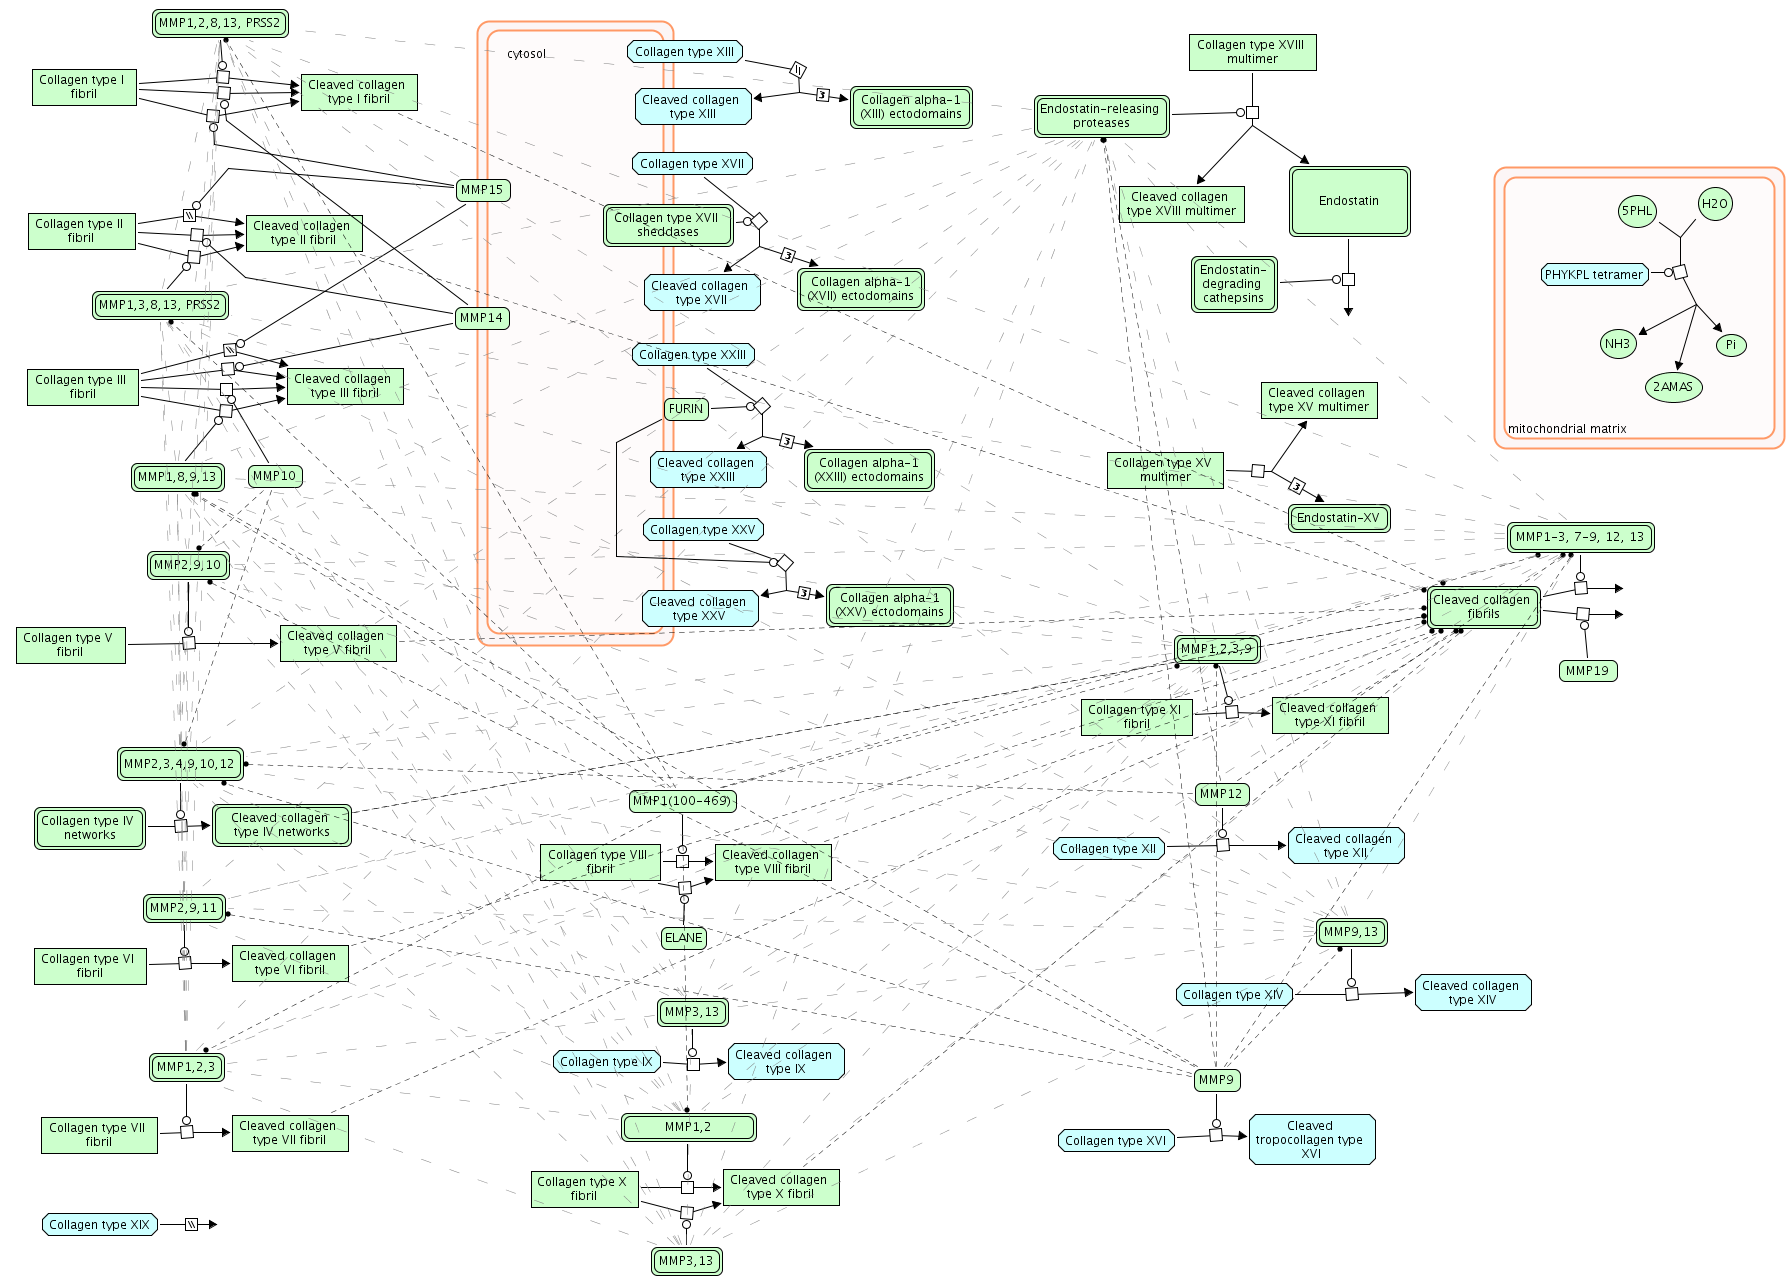
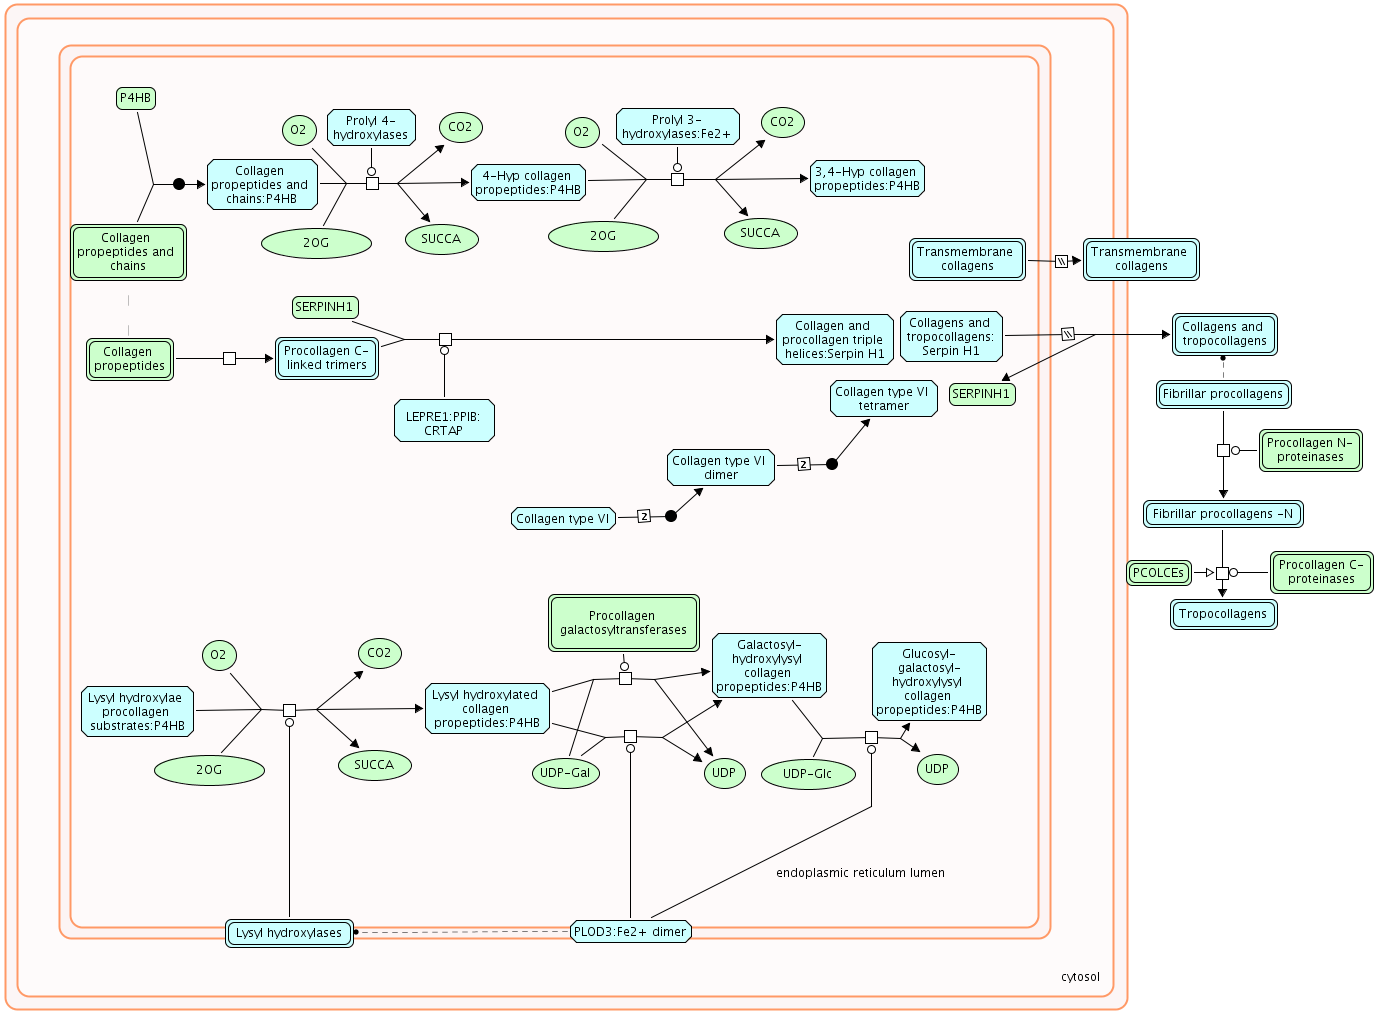
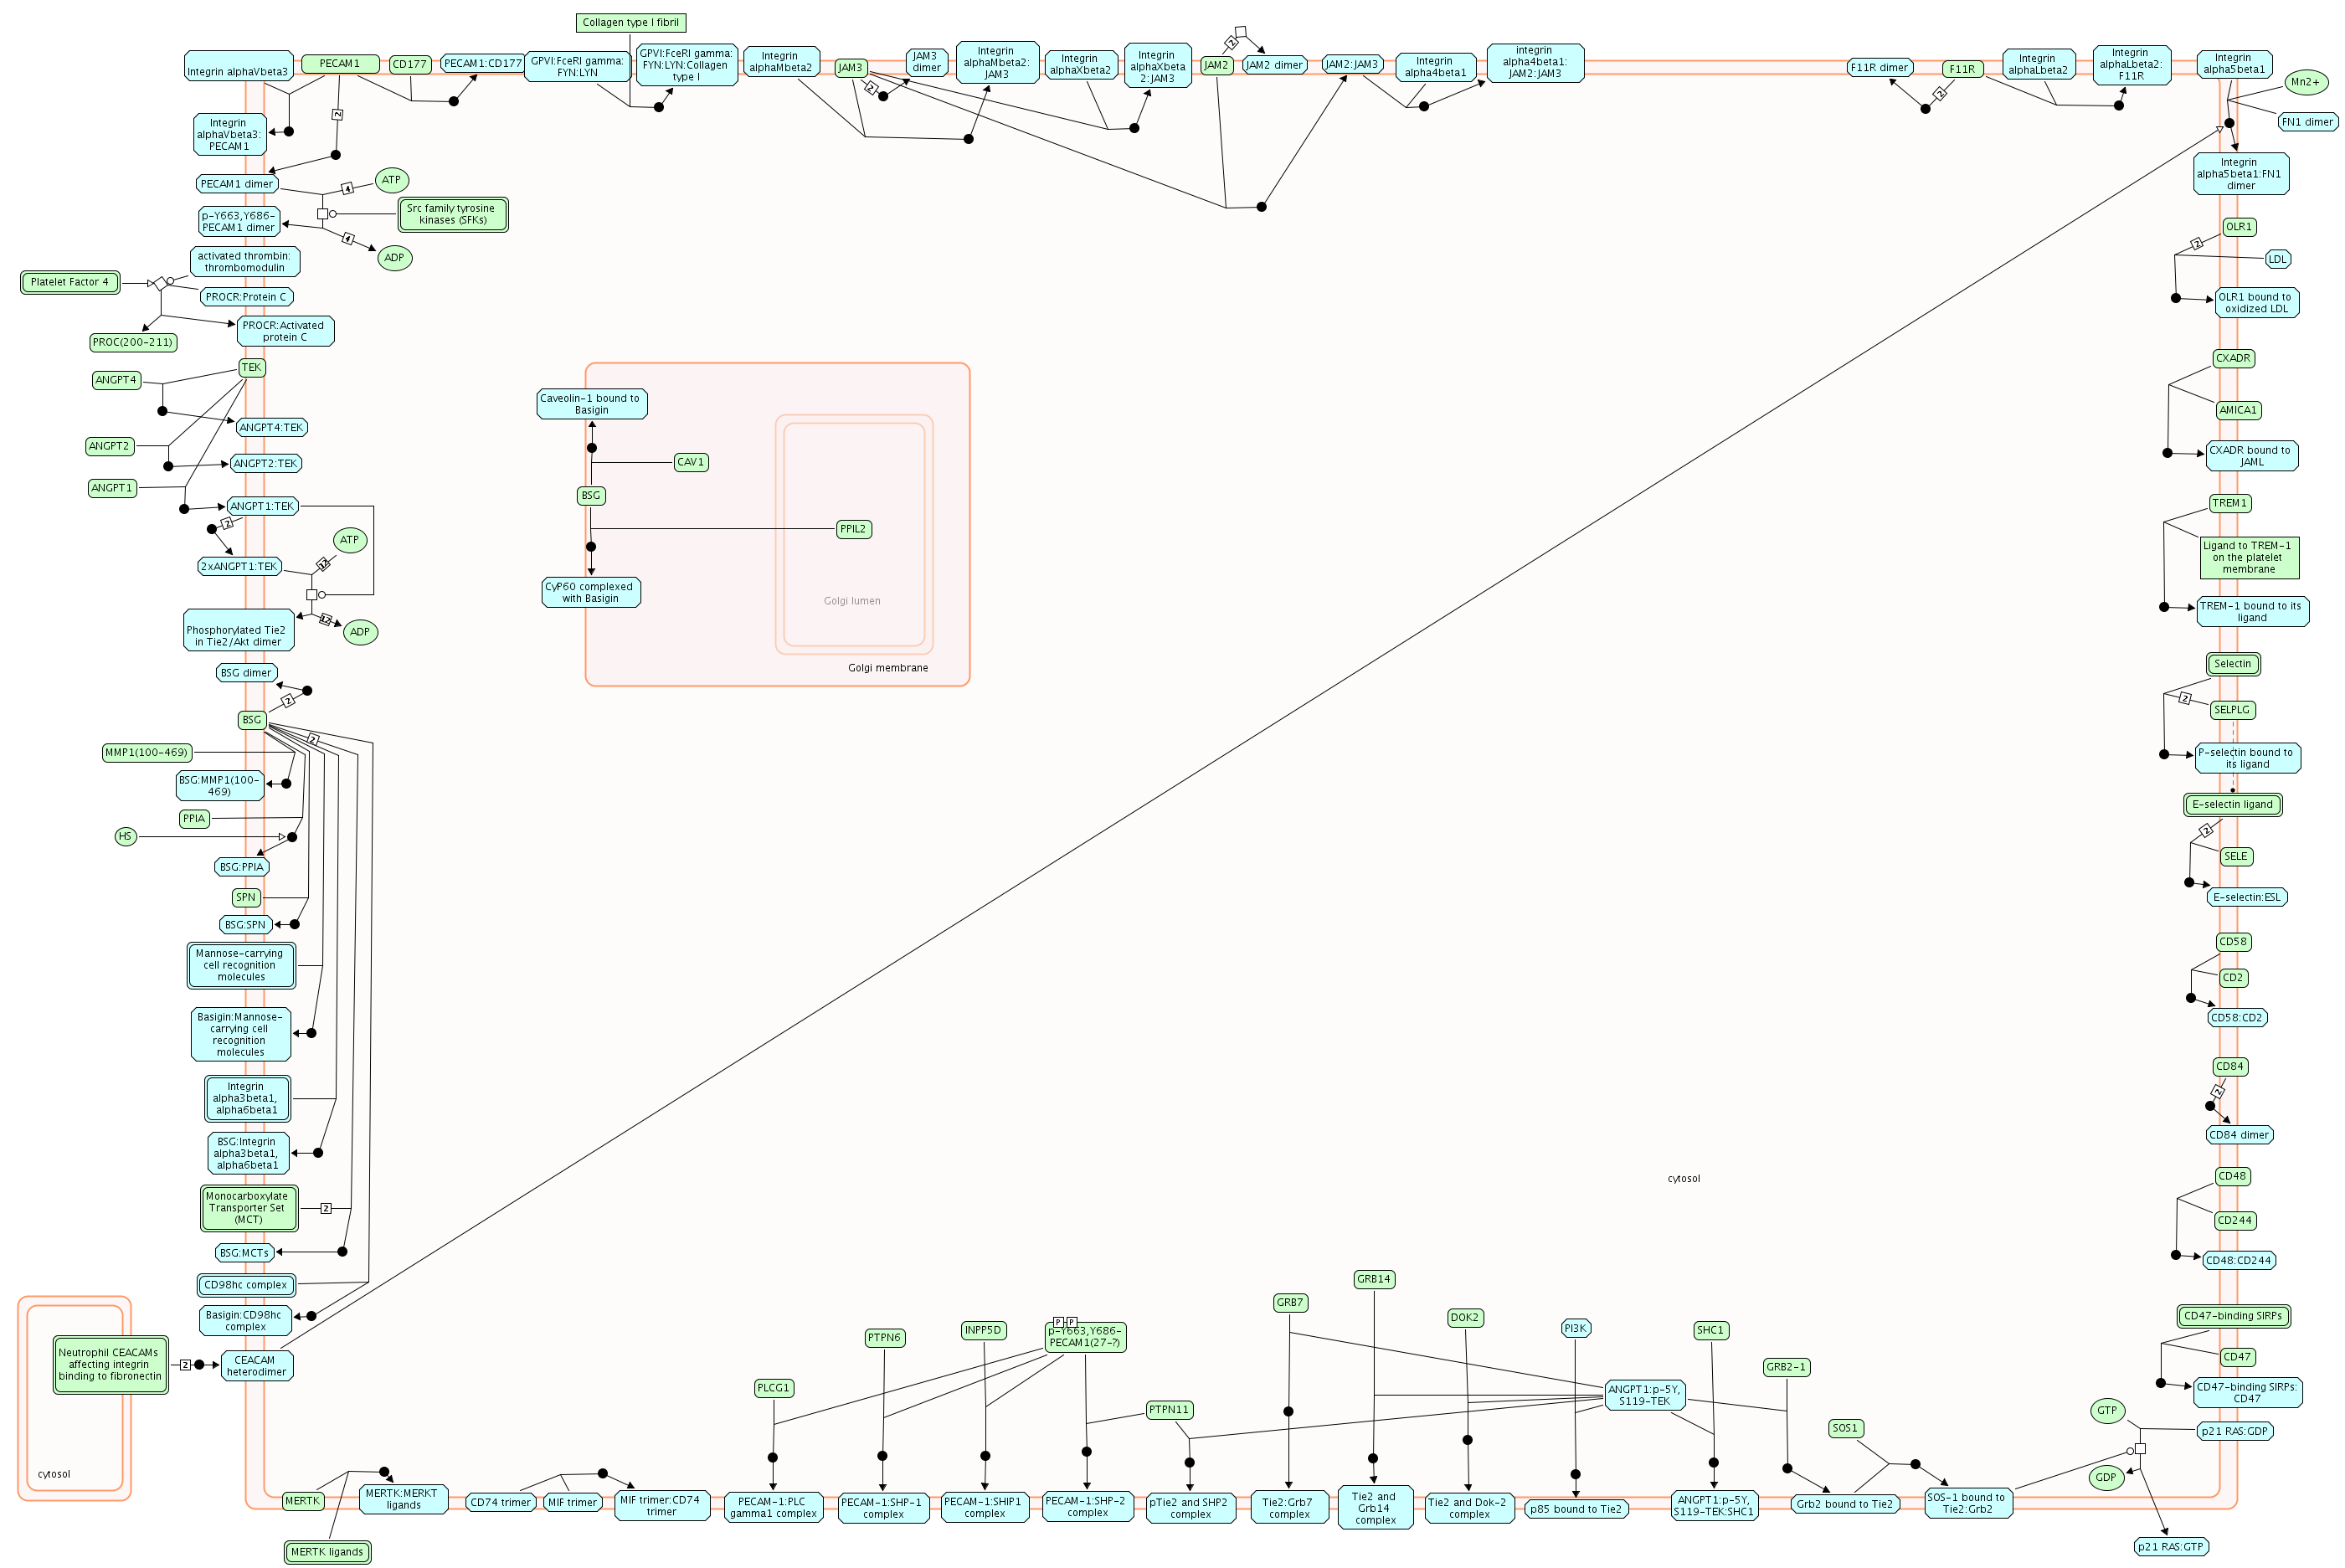
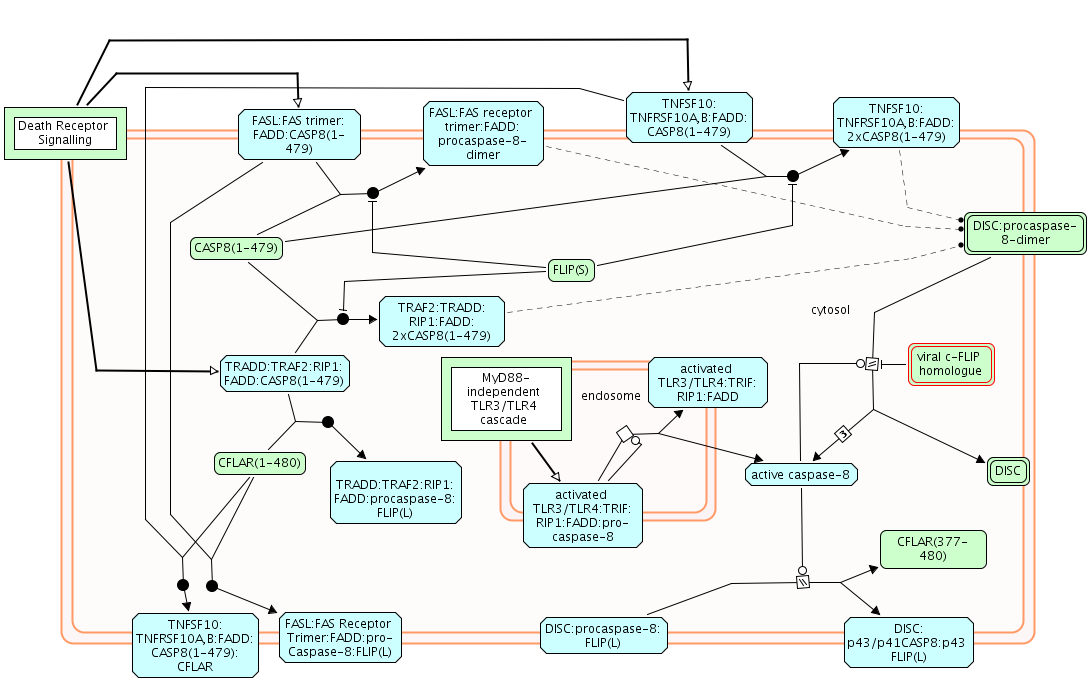
.png)
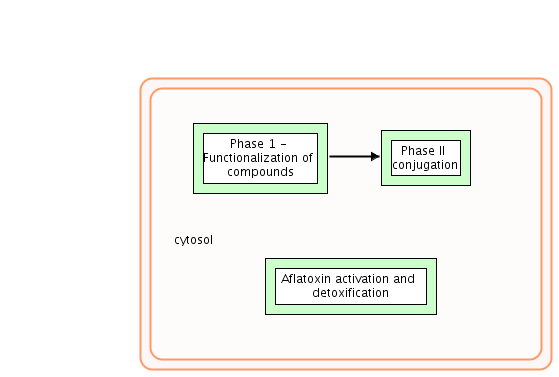
,%20Defective%20SLCO1B3%20ca.png)
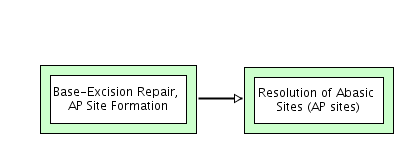
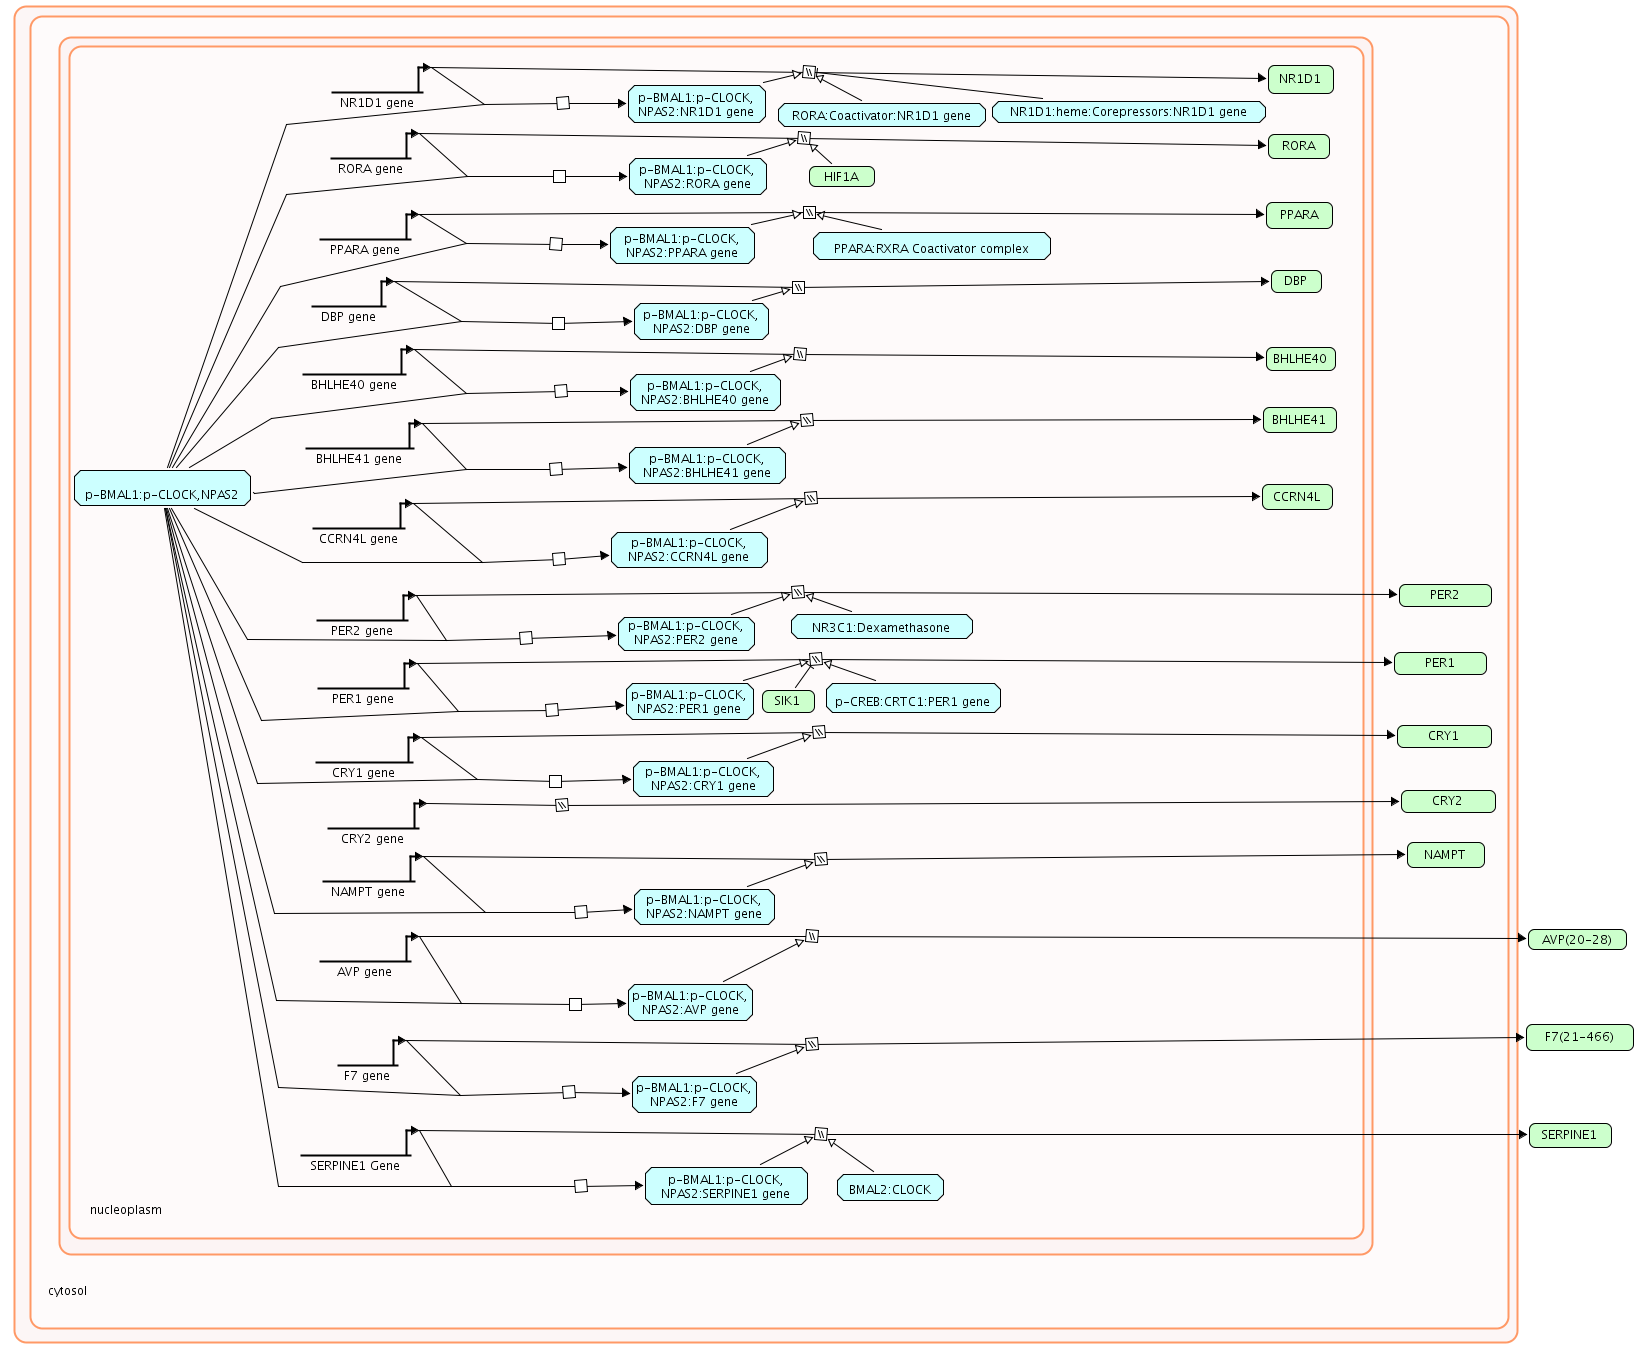
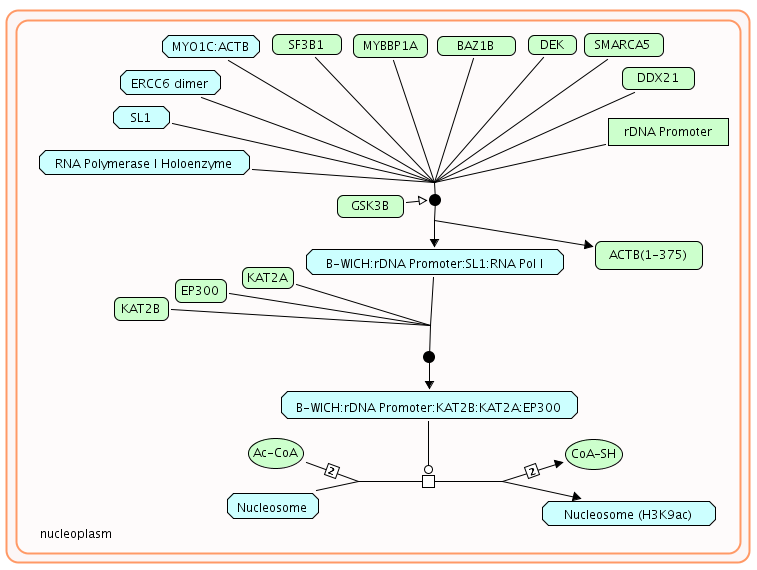
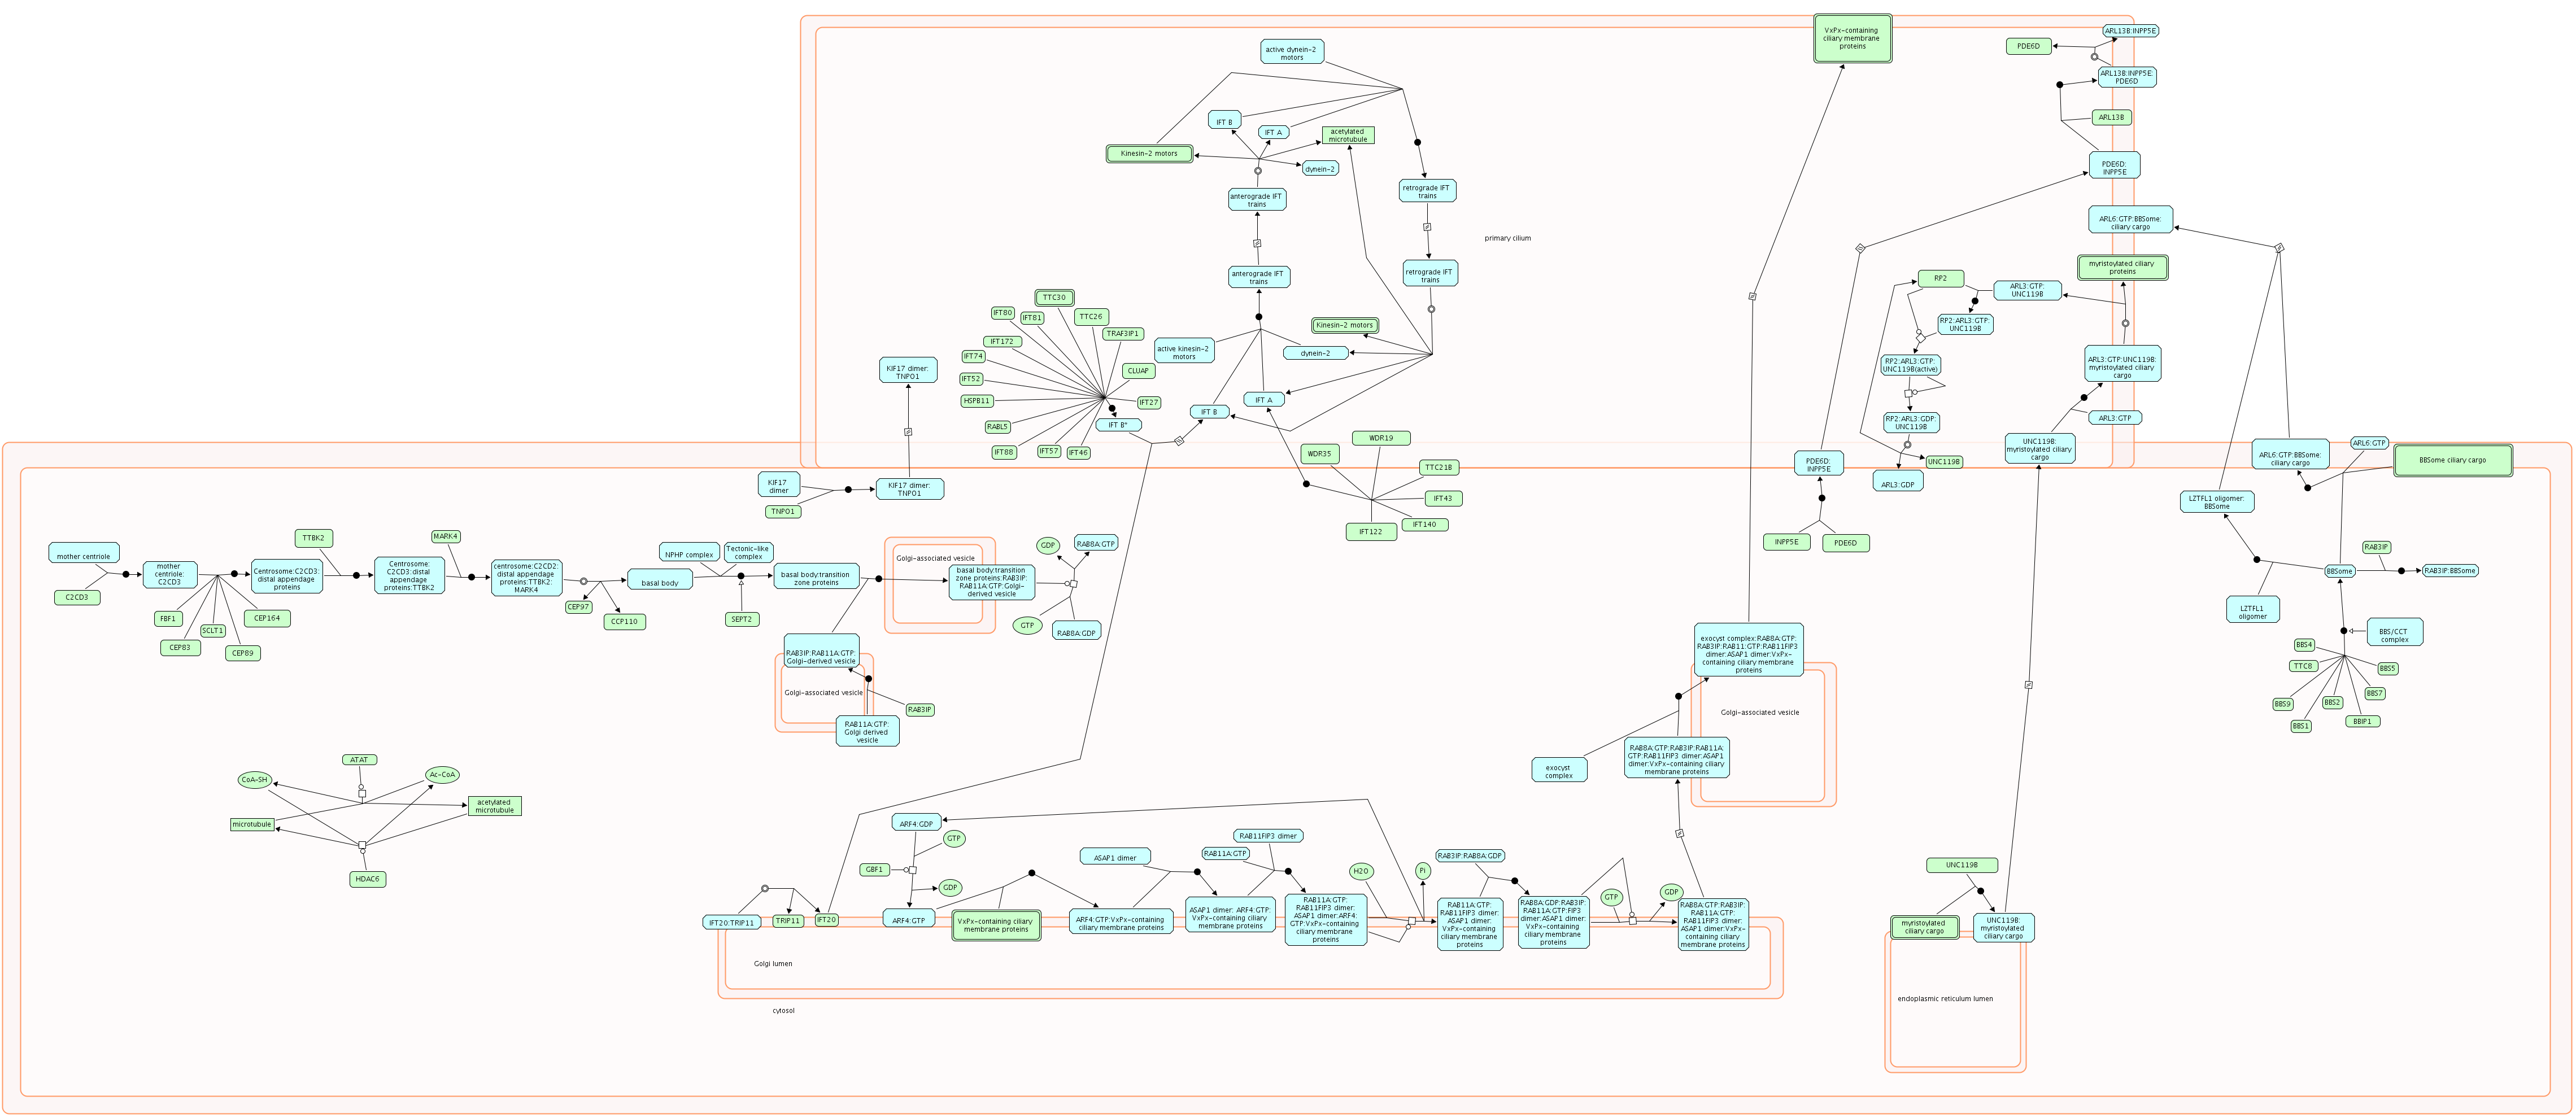
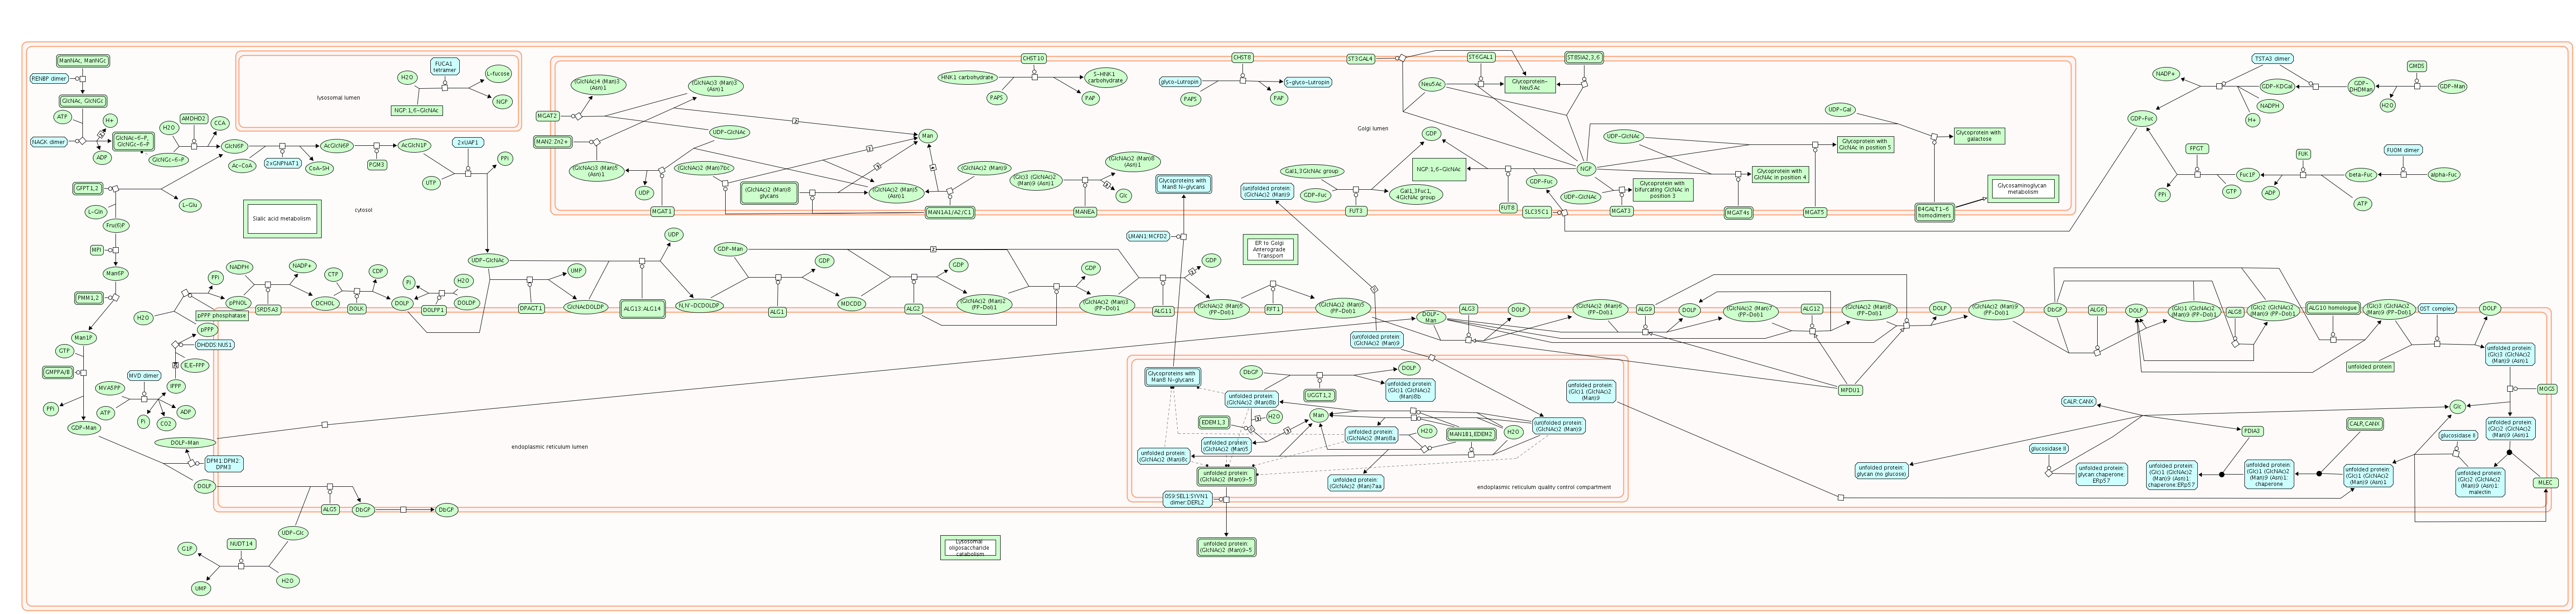
,%20Defective%20ALG11%20causes%20ALG11-CDG%20(CDG-1p),%20Defective%20ALG2%20causes%20ALG2-CDG%20(CDG-1i),%20Defective%20DPAGT1%20causes%20DPAGT1-CDG%20(CDG-1j)%20and%20CMSTA2,%20Defective%20GFPT1%20causes%20C.png)
.png)
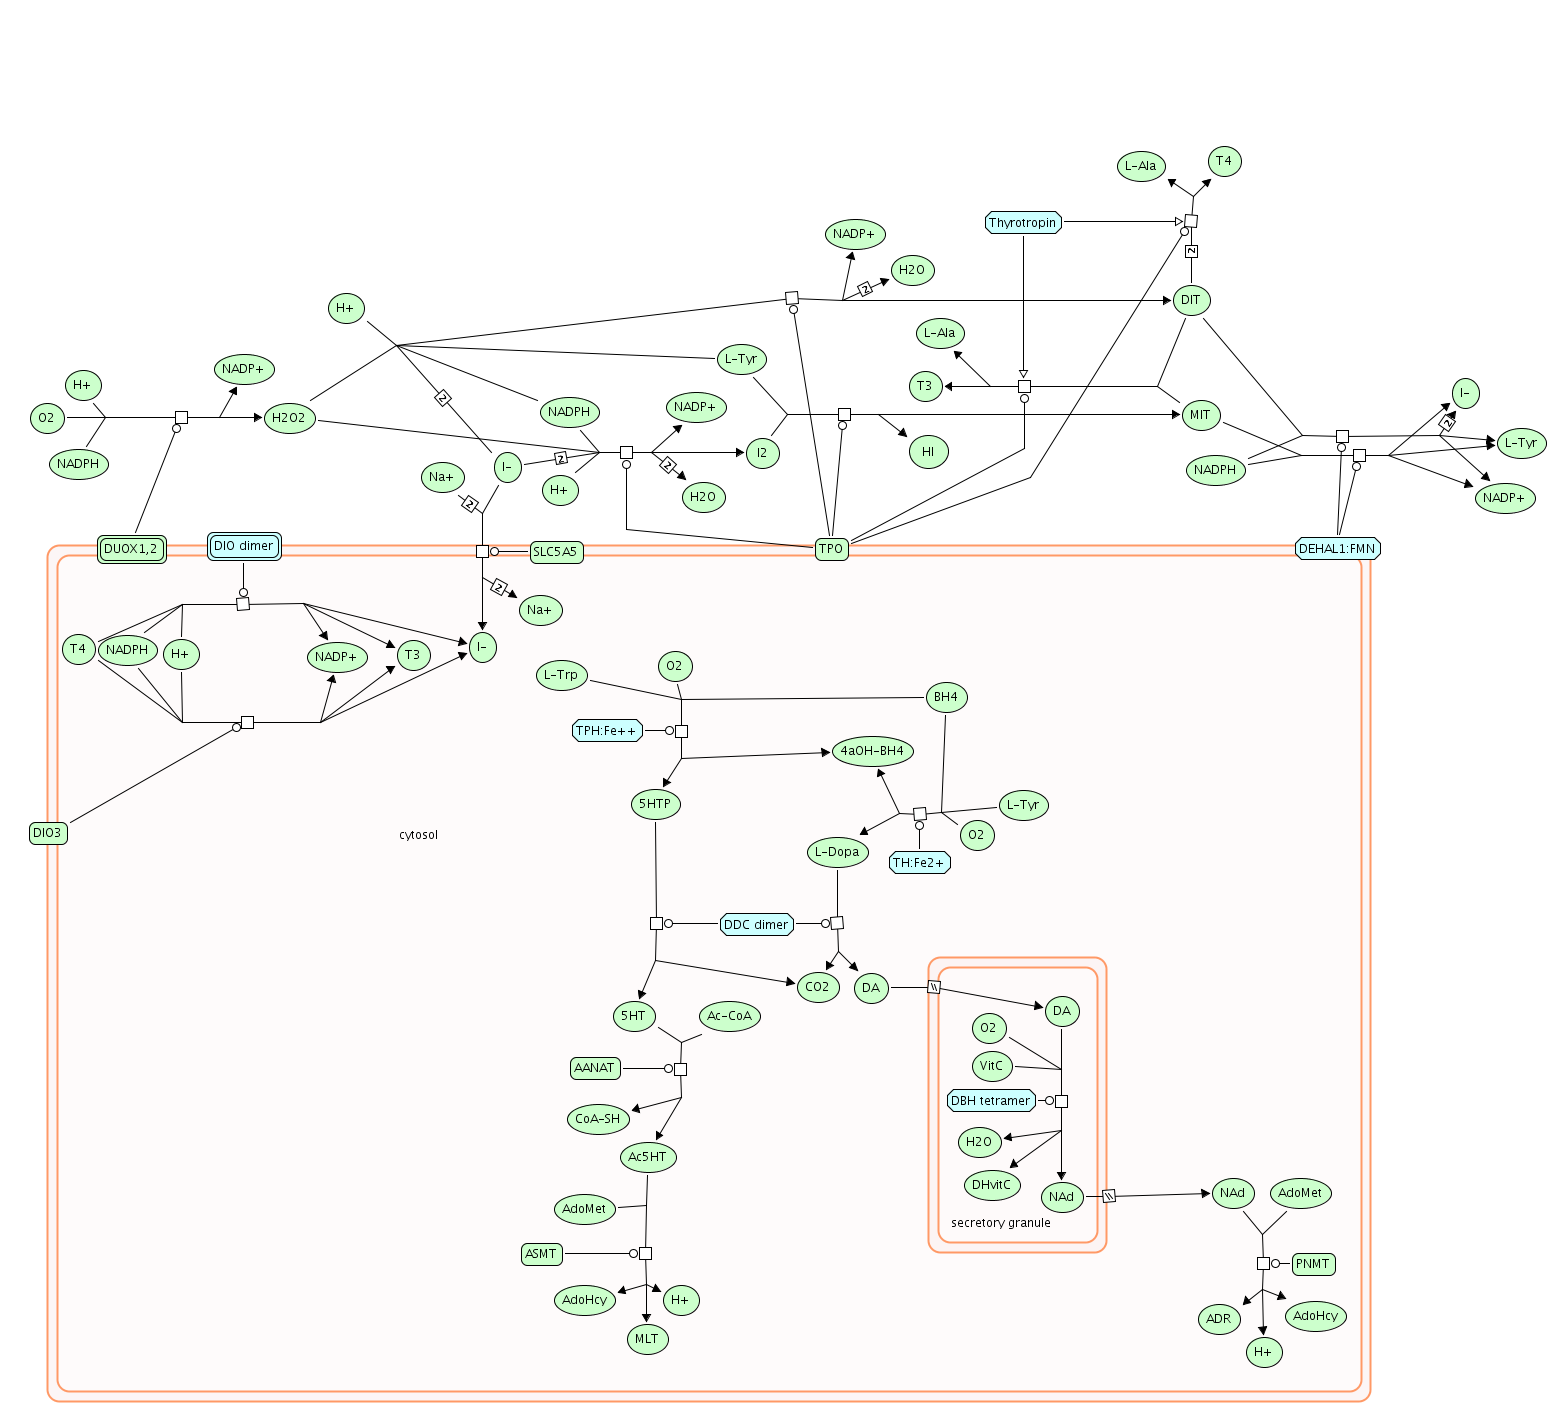
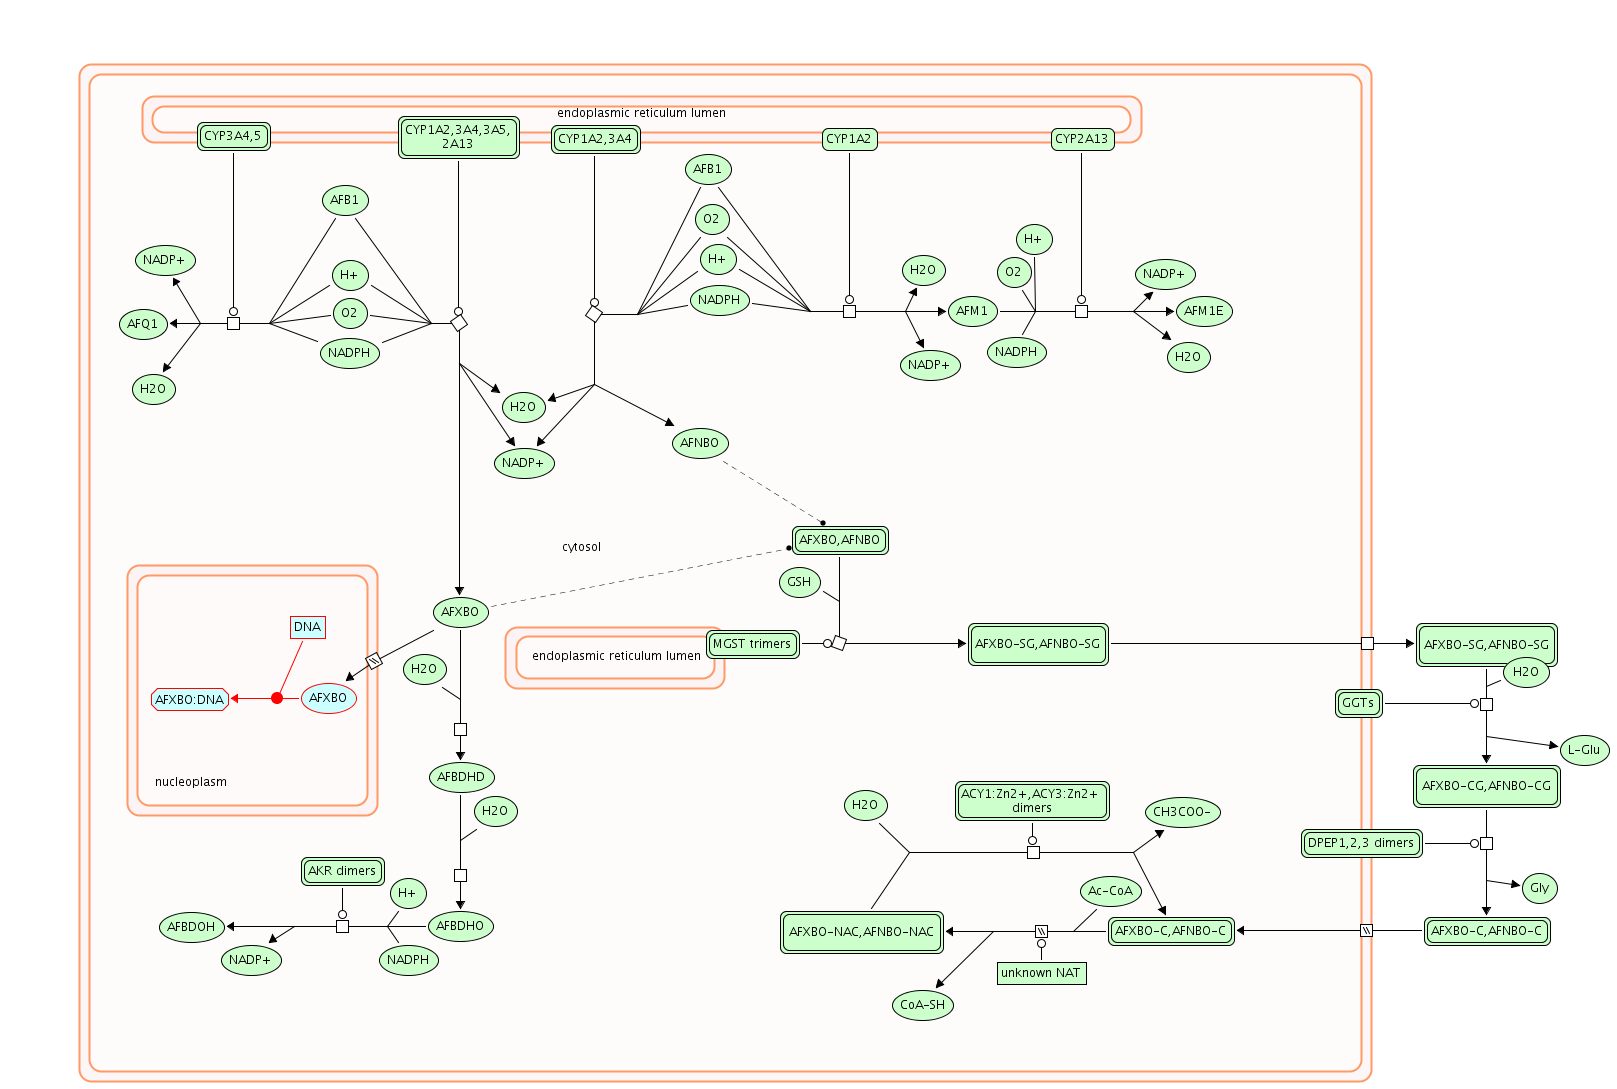
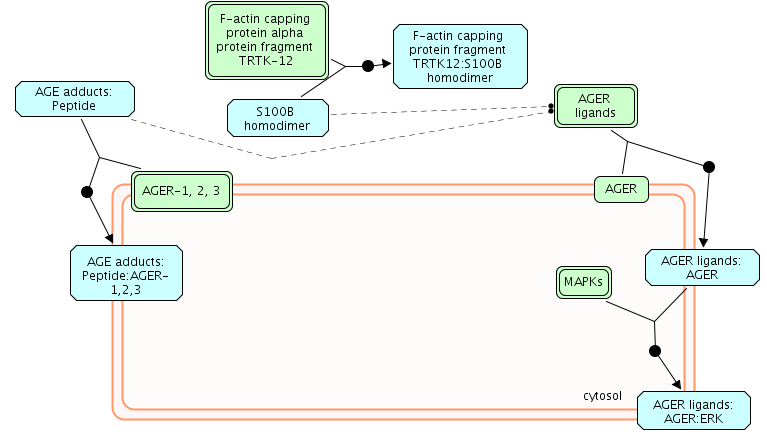
.png)
%20regulated%20genes%20KLK2%20and%20KLK3.png)
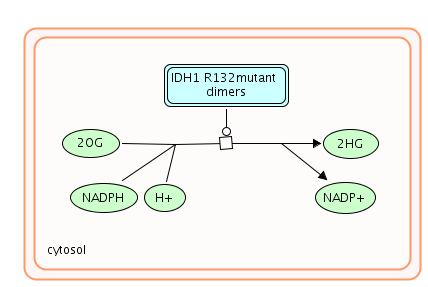
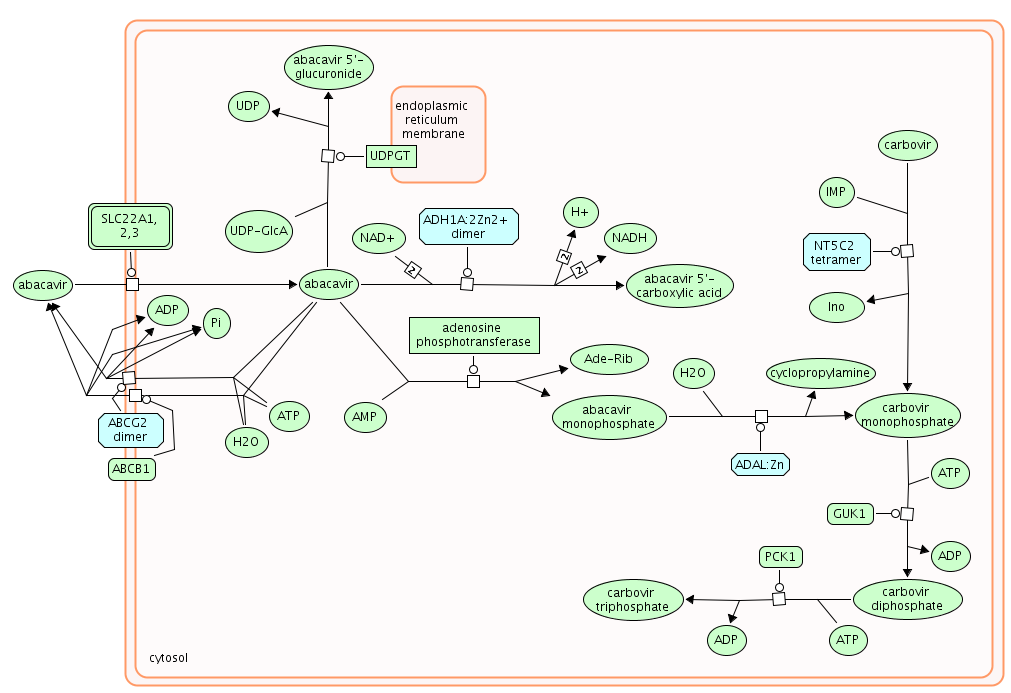
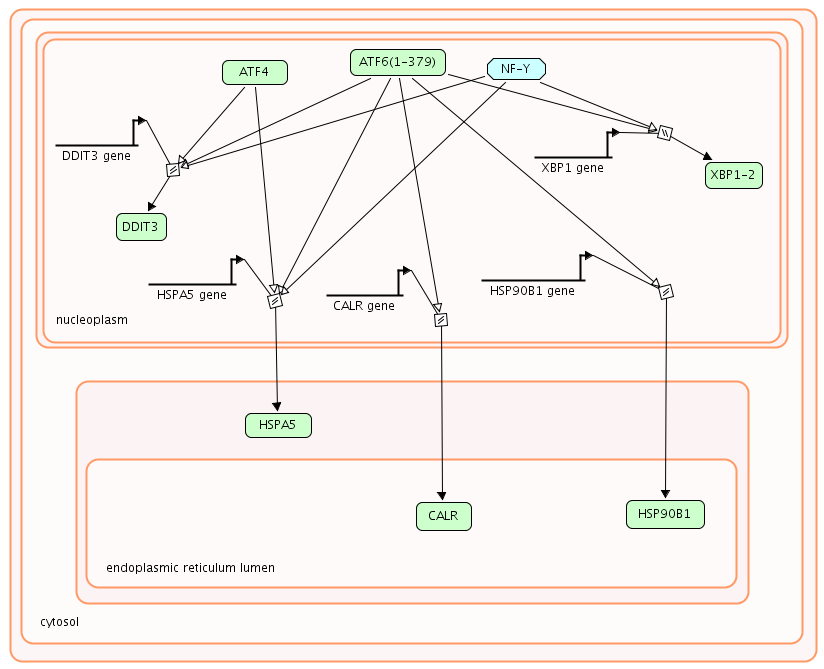
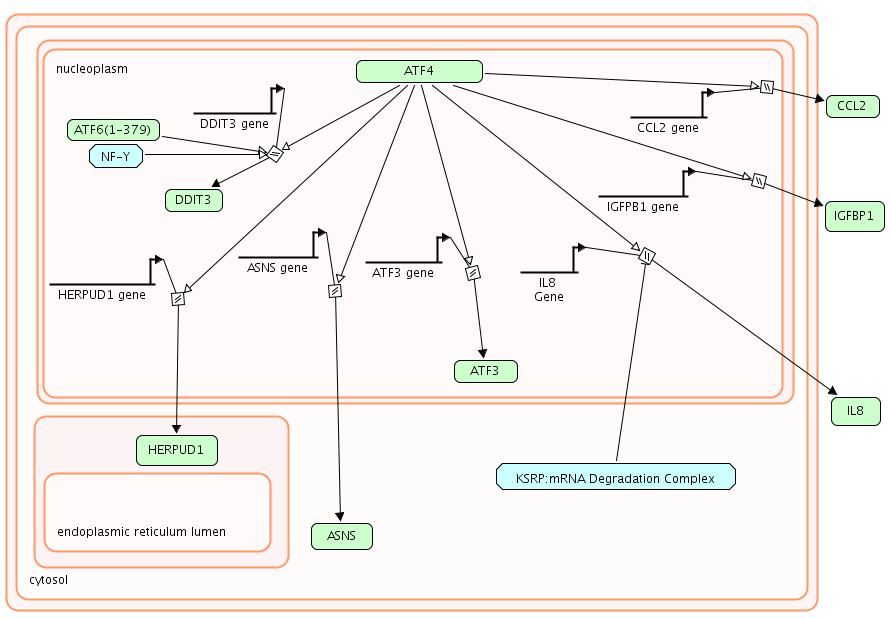
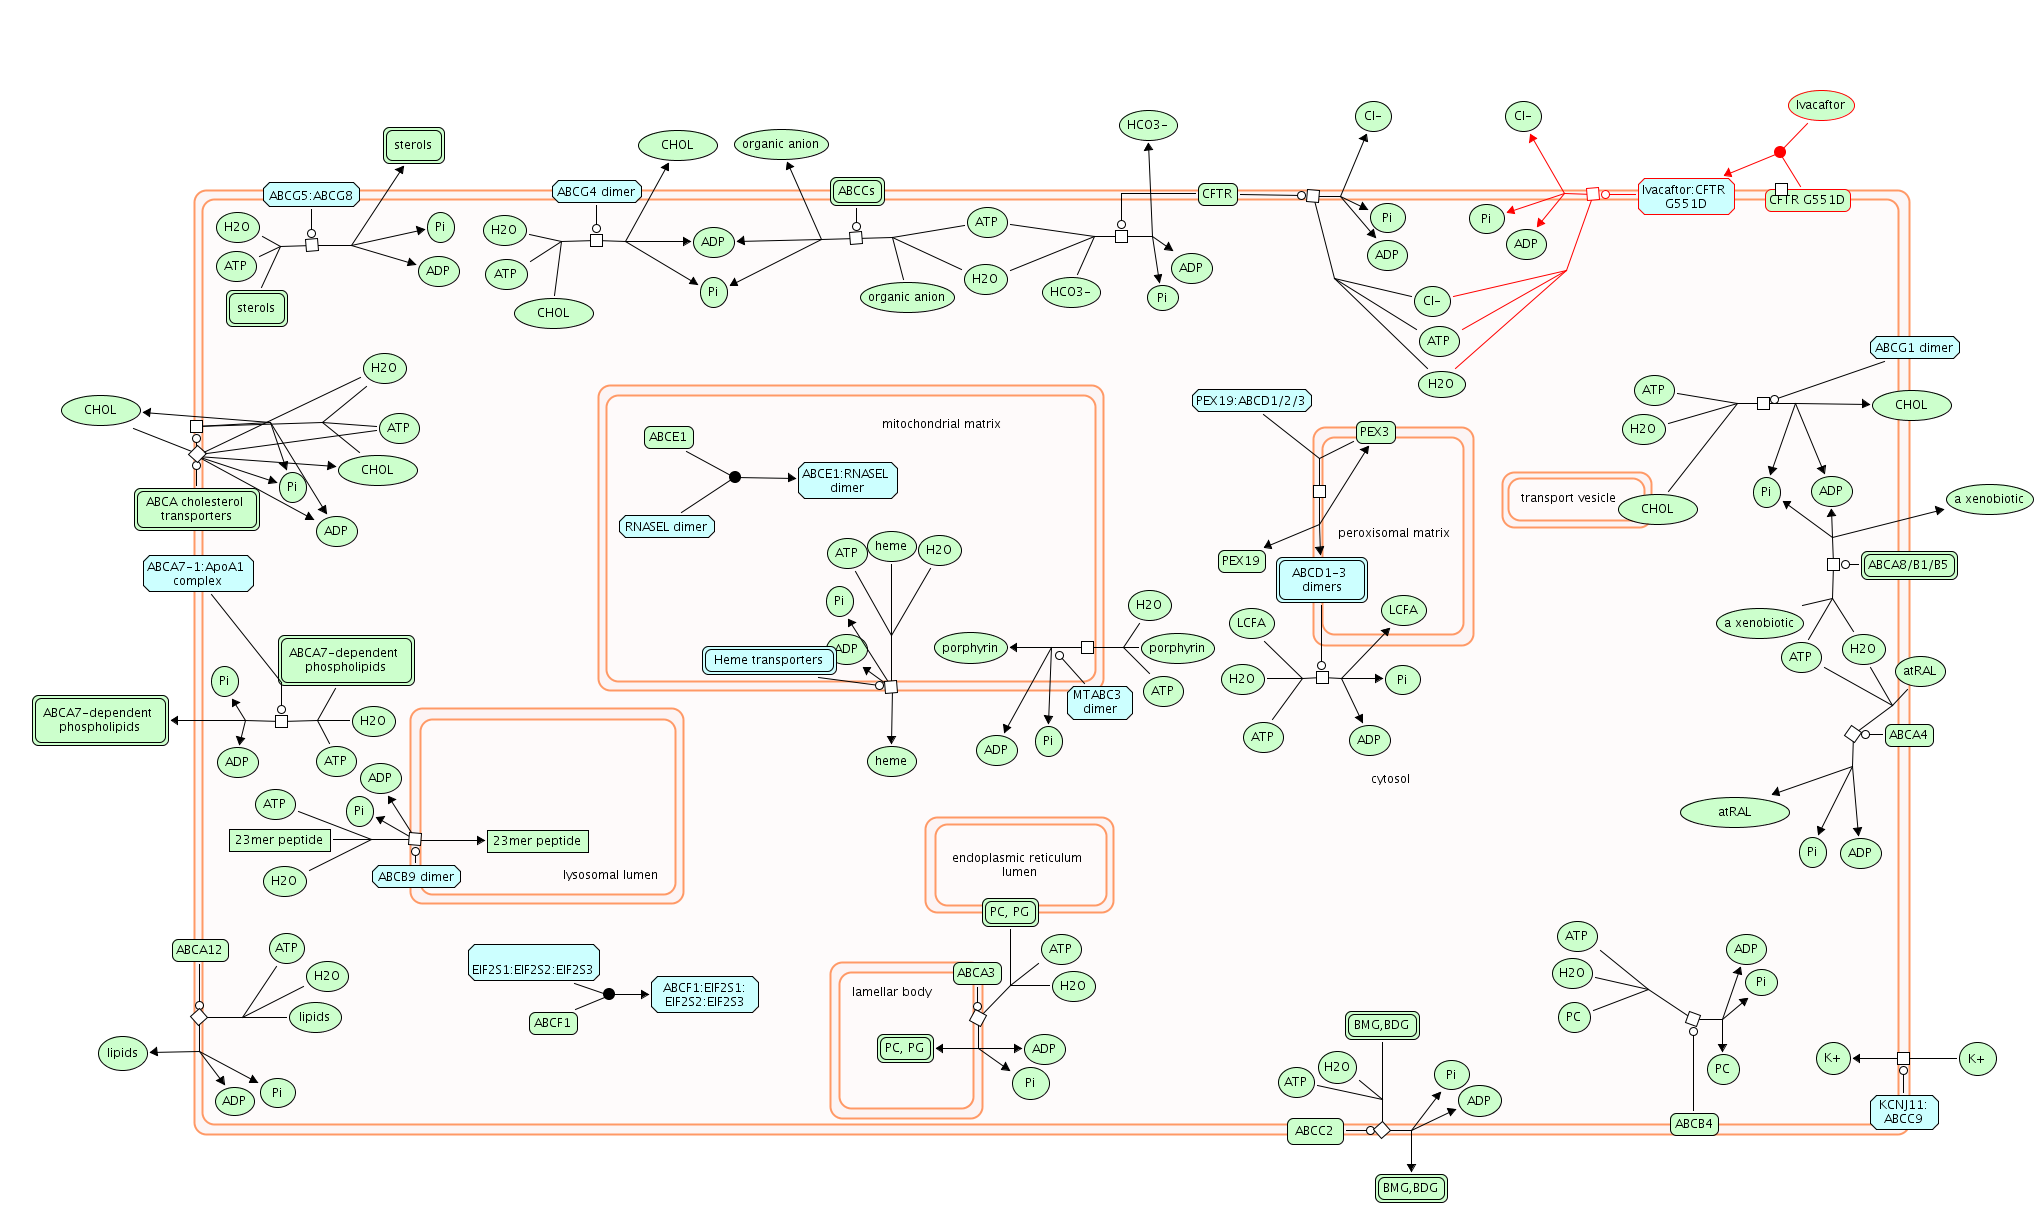